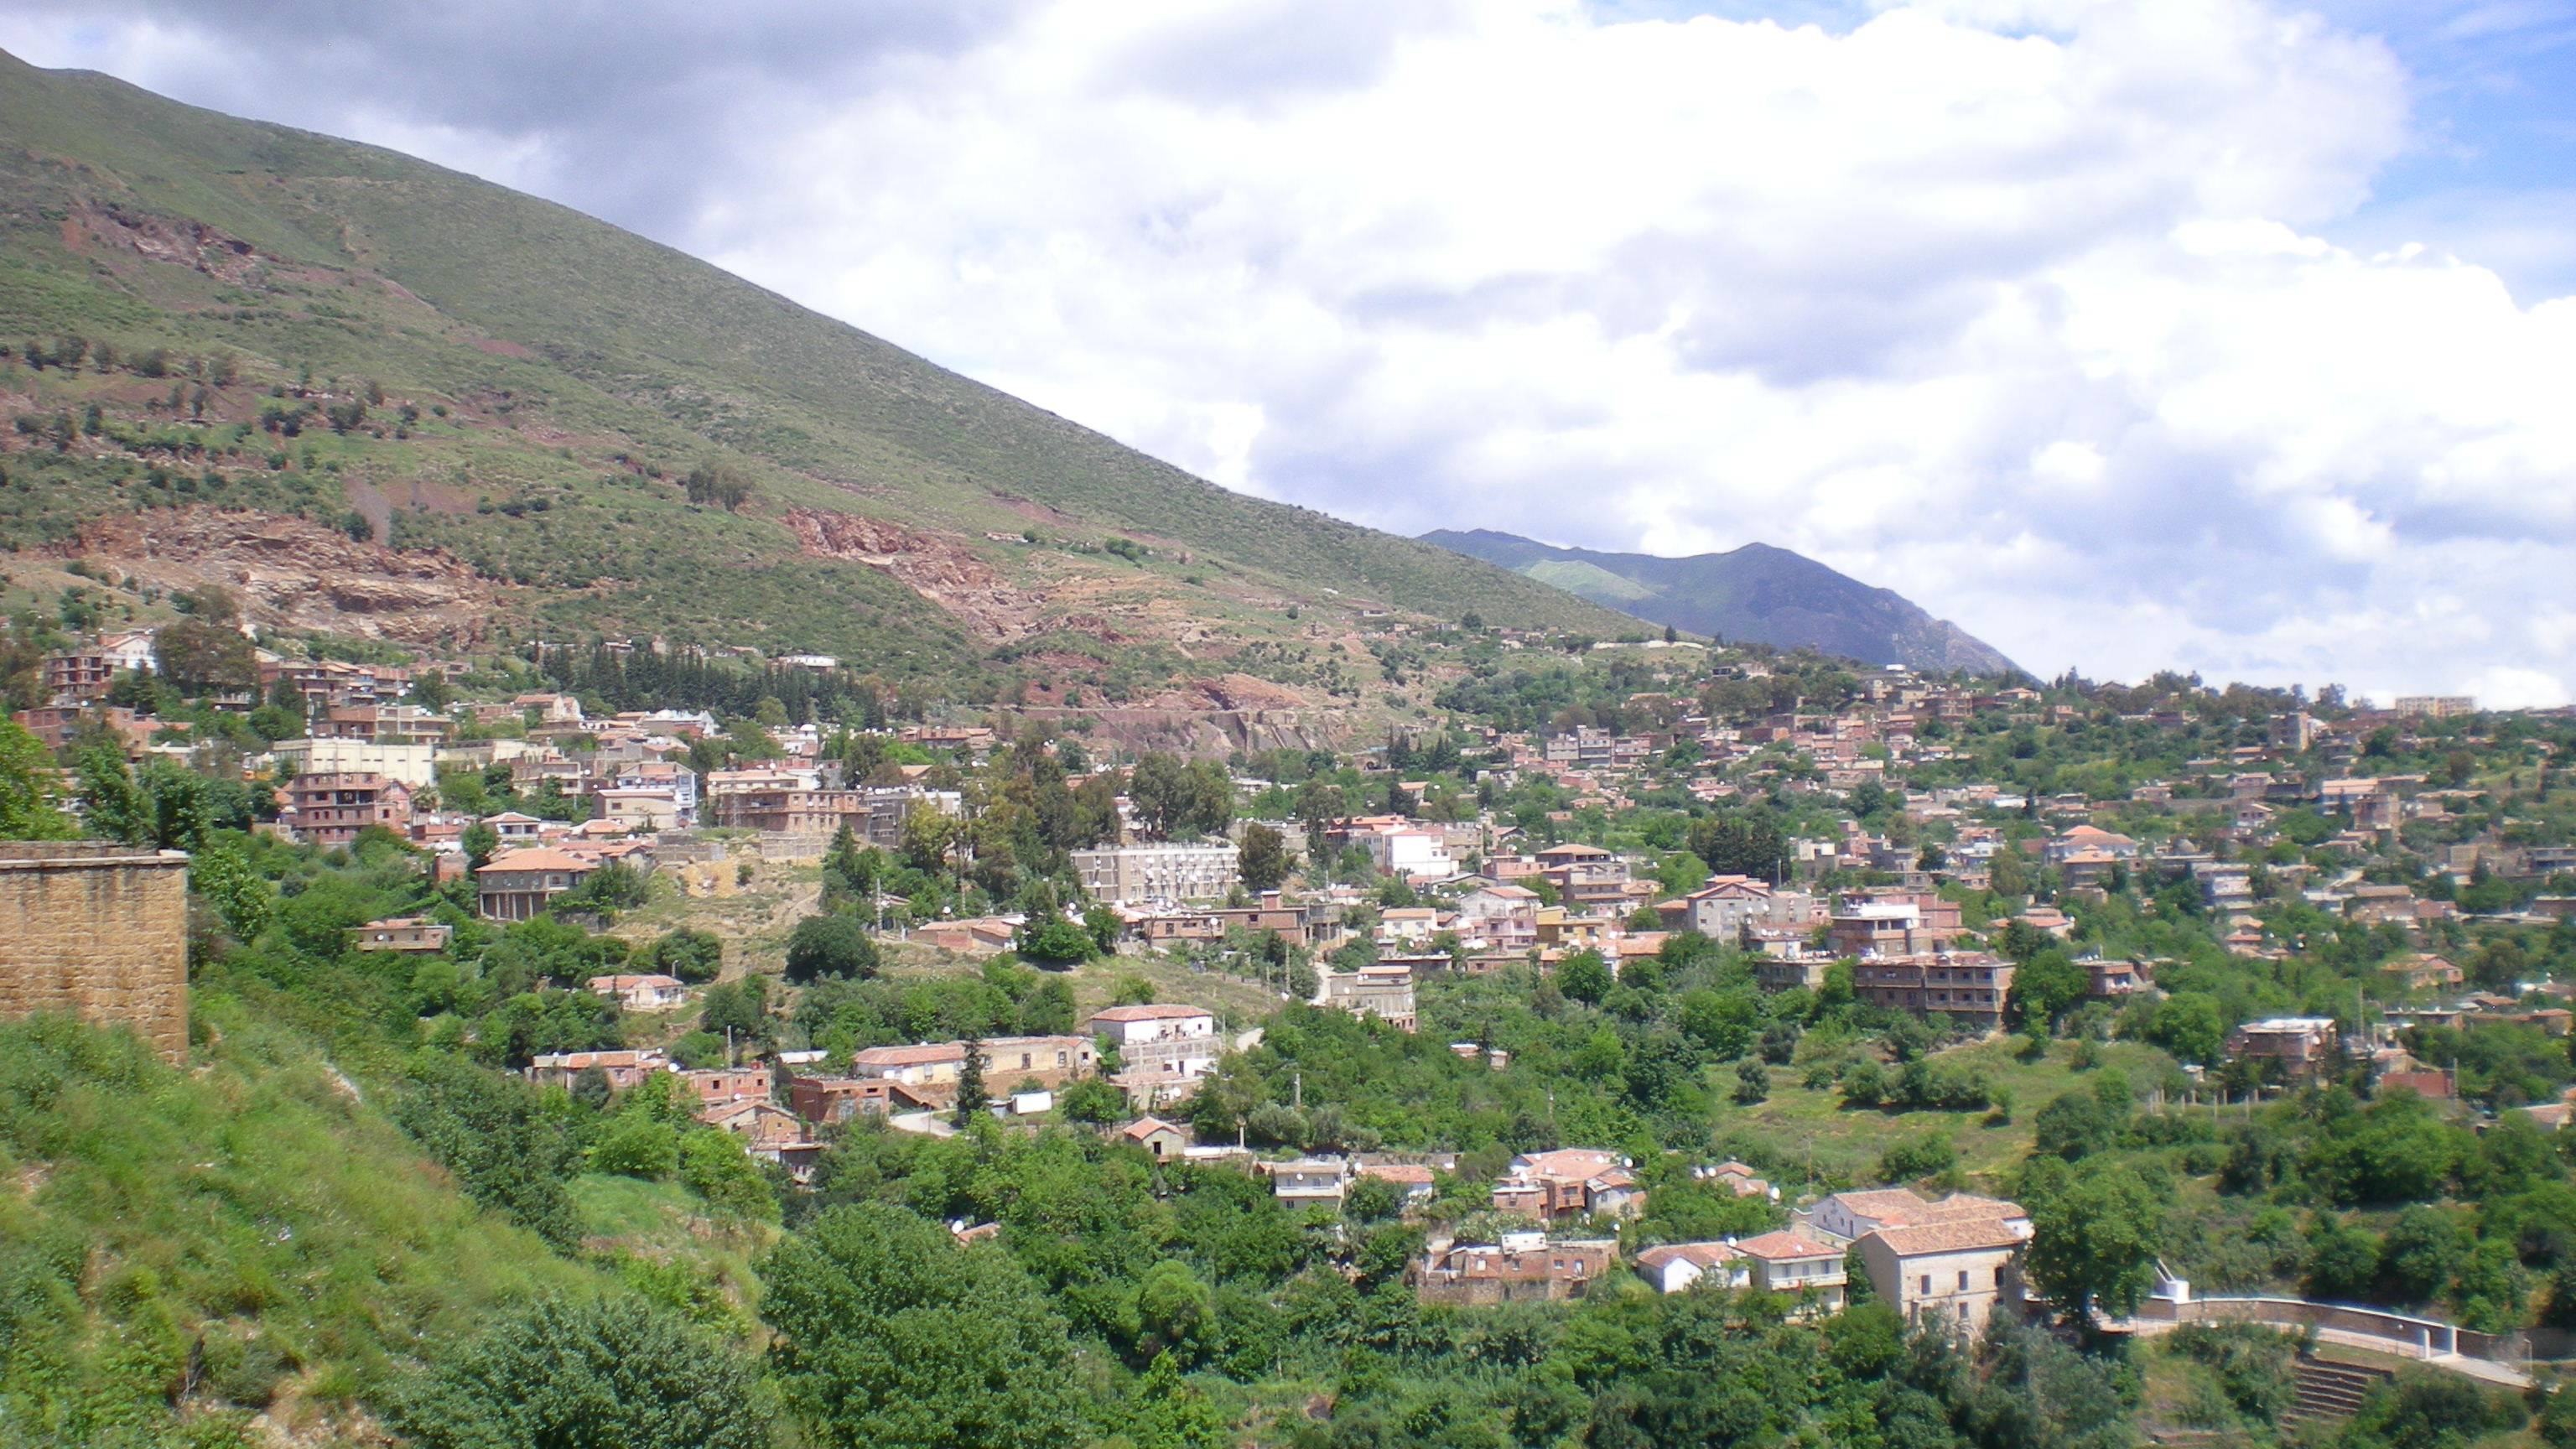
Kategooriad asukohas Cherchell
Tööstused
Ettevõtete jaotus tööstusharude kaupa piirkonnas Cherchell
| Tööstusharu kirjeldus | Asutuste arv | Keskmine Google'i hinnang |
|---|---|---|
| Ostlemine | 10 | 4.1 |
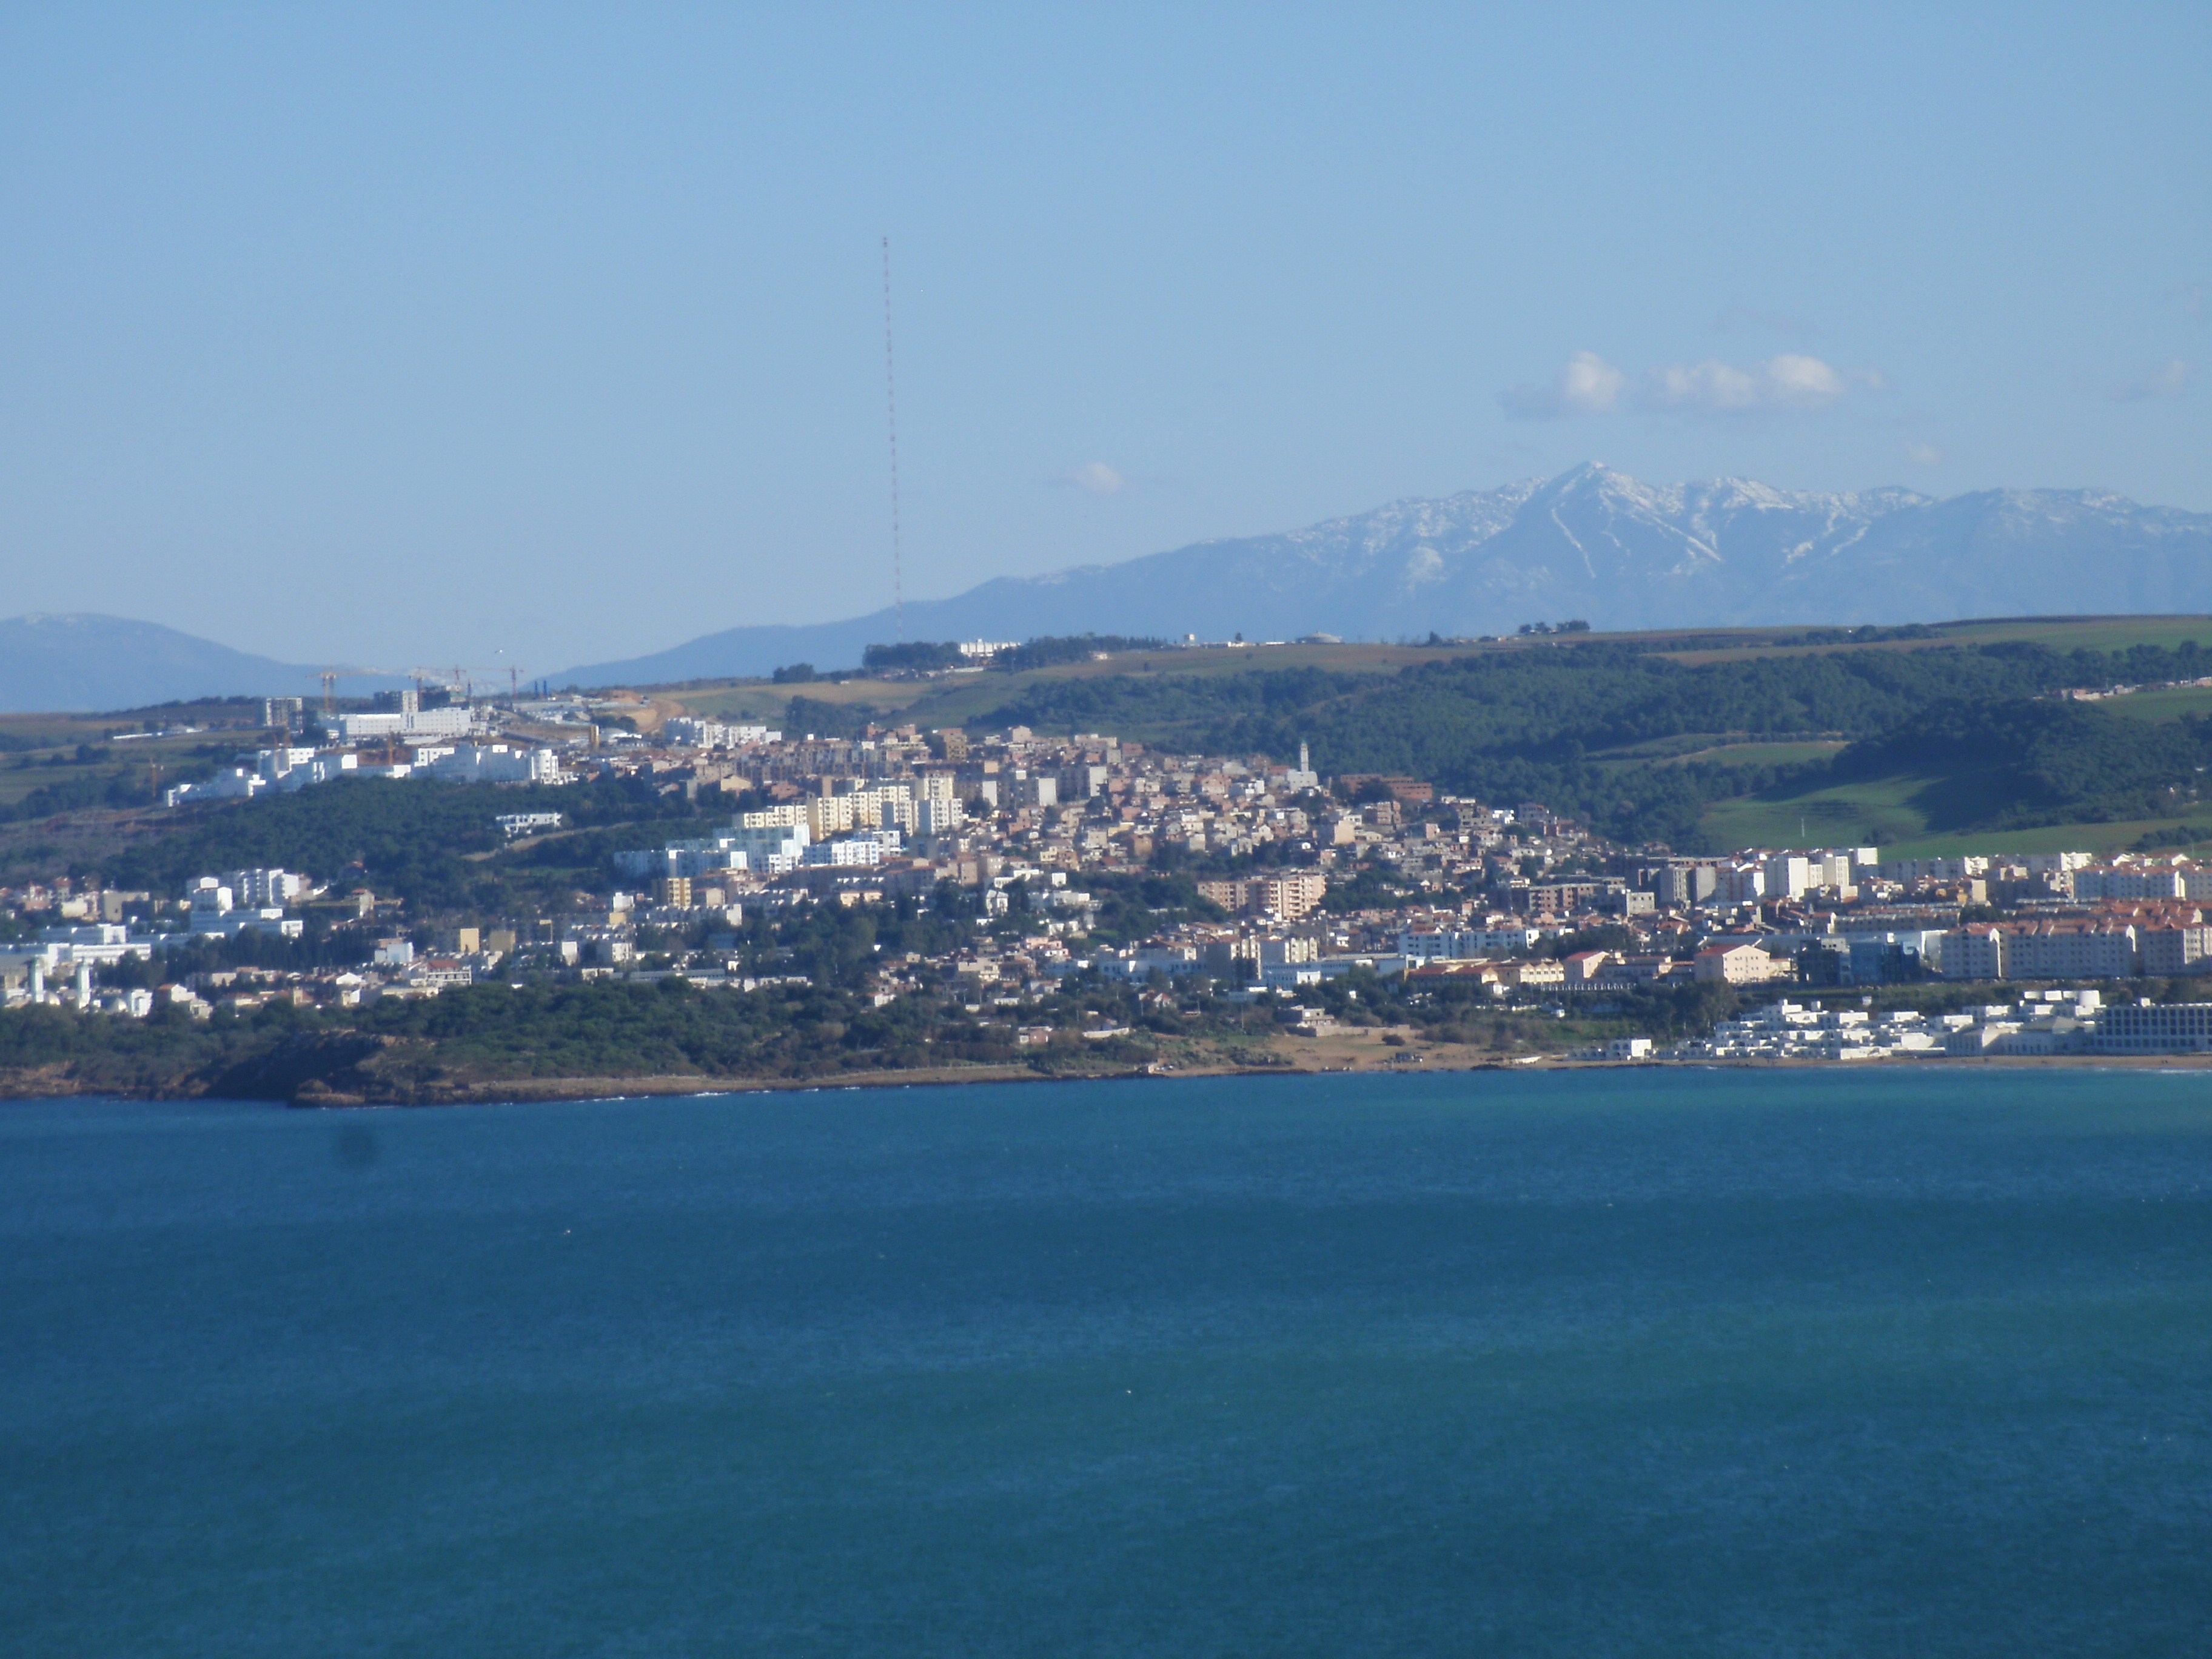
Cherchell faktid
| ala | 123.6 km² |
| Rahvastik | 56 769 |
| Meeste populatsioon | 27 984 (49.3%) |
| Naisrahvastik | 28 785 (50.7%) |
| Rahvastiku muutus (1975 to 2020) | +245.2% |
| Rahvastiku muutus (2000 to 2020) | +32.5% |
| Mediaanvanus | 27.8 aastat (Mehed: 27.6, Naised: 27.9) |
| Kohalik Aeg | |
| Ajatsoon | Kesk-Euroopa standardaeg |
| Laius- ja pikkuskraad | 36.60500, 2.19083 |
| Postiindeksid | 42002 |
Asukoha Cherchell kaart
Interaktiivne kaart
Cherchell rahvastik
Aastad 1975 kuni 2020
| Data | 1975 | 1990 | 2000 | 2015 | 2020 |
|---|---|---|---|---|---|
| Rahvastik | 16 443 | 33 465 | 42 835 | 53 318 | 56 769 |
| Rahvastiku tihedus | 133 / km² | 270,7 / km² | 346,5 / km² | 431,3 / km² | 459,2 / km² |
Cherchell rahvastiku muutus aastast 2000 aastani 2015
Kasv 24.5% aastast 2000 aastani 2015
| Asukoht | Muutus alates 1975 | Muutus alates 1990 | Muutus alates 2000 |
|---|---|---|---|
| Cherchell | +224.3% | +59.3% | +24.5% |
| Wilaya de Tipaza | +369.6% | +110.6% | +50.4% |
| Alžeeria | +137.8% | +53.3% | +27.3% |
Cherchell mediaanvanus
Mediaanvanus: 27.8 aastat
| Asukoht | Mediaanvanus | Keskmine vanus (naine) | Keskmine vanus (mees) |
|---|---|---|---|
| Cherchell | 27.8 yrs | 27.9 yrs | 27.6 yrs |
| Wilaya de Tipaza | 26.7 yrs | 26.8 yrs | 26.6 yrs |
| Alžeeria | 25.1 yrs | 25.3 yrs | 24.9 yrs |
Cherchell rahvastikutihedus
Rahvastikutihedus: 459 / km²
| Asukoht | Rahvastik | ala | Tihedus |
|---|---|---|---|
| Cherchell | 56 769 | 123,6 km² | 459 / km² |
| Wilaya de Tipaza | 1,3 million | 1973,3 km² | 654 / km² |
| Alžeeria | 39,5 million | 2 312 254,9 km² | 17,1 / km² |
Cherchell ajalooline ja prognoositud rahvastik
Hinnanguline rahvastik aastast 0 aastani 2100
- JRC (European Commission's Joint Research Centre) töötama GHS built-up grid
- CIESIN (Center for International Earth Science Information Network)
- [Link] Klein Goldewijk, K., Beusen, A., Doelman, J., and Stehfest, E.: Anthropogenic land use estimates for the Holocene – HYDE 3.2, Earth Syst. Sci. Data, 9, 927–953, https://doi.org/10.5194/essd-9-927-2017, 2017.
Suunakoodid
Suunakoodide protsent, mida kasutavad ettevõtted asukohas Cherchell
Inimarengu indeks (HDI)
Eeldatava eluea, hariduse ja elaniku sissetuleku statistiline liitindeks.
Cherchell CO2 heitkogused
Süsinikdioksiidi (CO2) heide inimese kohta tonnides aastas
| Asukoht | CO2 heitkogused | CO2 emissioon elaniku kohta | CO2 heite intensiivsus |
|---|---|---|---|
| Cherchell | 113,774 tn | 2 tn | 920.3 tons/km² |
| Wilaya de Tipaza | 2,667,150 tn | 2.07 tn | 1,351.6 tons/km² |
| Alžeeria | 69,721,458 tn | 1.77 tn | 30.2 tons/km² |
| 2013. aasta CO2 heitkogused (tonni/aastas) | 113,774 tn |
| 2013. aasta CO2 heitkogused (tonni/aastas) inimese kohta | 2 tn |
| 2013. aasta CO2 heitkoguste intensiivsus (tonni/km²/aastas) | 920.3 tons/km² |
Looduslike ohtude oht
Relative risk out of 10
| Oht | Risk Level |
|---|---|
| Drought | Medium (5) |
| Flood | Medium (7) |
| Earthquake | Medium (5.2) |
* Risk, particularly concerning flood or landslide, may not be for the entire area.
- Dilley, M., R.S. Chen, U. Deichmann, A.L. Lerner-Lam, M. Arnold, J. Agwe, P. Buys, O. Kjekstad, B. Lyon, and G. Yetman. 2005. Natural Disaster Hotspots: A Global Risk Analysis. Washington, D.C.: World Bank. https://doi.org/10.1596/0-8213-5930-4.
- Center for Hazards and Risk Research - CHRR - Columbia University, Center for International Earth Science Information Network - CIESIN - Columbia University, and International Research Institute for Climate and Society - IRI - Columbia University. 2005. Global Drought Hazard Frequency and Distribution. Palisades, NY: NASA Socioeconomic Data and Applications Center (SEDAC). https://doi.org/10.7927/H4VX0DFT.
- Center for Hazards and Risk Research - CHRR - Columbia University, Center for International Earth Science Information Network - CIESIN - Columbia University. 2005. Global Flood Hazard Frequency and Distribution. Palisades, NY: NASA Socioeconomic Data and Applications Center (SEDAC). https://doi.org/10.7927/H4668B3D.
- Center for Hazards and Risk Research - CHRR - Columbia University, Center for International Earth Science Information Network - CIESIN - Columbia University. 2005. Global Earthquake Hazard Distribution - Peak Ground Acceleration. Palisades, NY: NASA Socioeconomic Data and Applications Center (SEDAC). https://doi.org/10.7927/H4BZ63ZS.
Viimased lähedal asuvad maavärinad
Magnituud 3,0 ja suurem
| Kuupäev▼ | Aeg↕ | Magnitude↕ | Distance↕ | Sügavus↕ | Asukoht↕ | Link |
|---|---|---|---|---|---|---|
| 1/8/18 | 4:20 PM | 4.5 | 29.3 km | 10,000 m | 6km ESE of Hadjout, Algeria | usgs.gov |
| 1/2/18 | 8:59 PM | 4.7 | 40.3 km | 8,260 m | 11km SW of El Affroun, Algeria | usgs.gov |
| 6/11/16 | 10:57 PM | 4.1 | 13.1 km | 10,000 m | 11km WNW of Tipasa, Algeria | usgs.gov |
| 11/2/09 | 7:28 AM | 4.4 | 53.7 km | 10,100 m | northern Algeria | usgs.gov |
| 10/12/08 | 1:20 AM | 3.2 | 45.1 km | 0 m | northern Algeria | usgs.gov |
| 9/28/08 | 2:36 AM | 4 | 30.6 km | 0 m | northern Algeria | usgs.gov |
| 4/10/08 | 8:54 PM | 3.6 | 44.7 km | 0 m | northern Algeria | usgs.gov |
| 3/17/08 | 6:28 PM | 3.5 | 47.2 km | 0 m | northern Algeria | usgs.gov |
| 2/16/08 | 9:33 PM | 3.8 | 9.6 km | 10,000 m | northern Algeria | usgs.gov |
| 2/16/08 | 8:12 PM | 3.1 | 29.6 km | 0 m | northern Algeria | usgs.gov |

Meie andmete kohta
Sellel lehel olevad andmed on hinnatud mitmete avalikult kättesaadavate tööriistade ja ressursside abil. Need on esitatud ilma garantiita ja võivad sisaldada ebatäpsusi. Kasutage omal vastutusel.