Kategooriad asukohas Manado
Tööstused
Ettevõtete jaotus tööstusharude kaupa piirkonnas Manado
| Tööstusharu kirjeldus | Asutuste arv | Ettevõtluse keskmine vanus |
|---|---|---|
| Ostlemine | 5,409 | — |
| Restoranid | 4,307 | — |
| Kohvikud | 2,355 | — |
| Muu majutus | 2,281 | — |
| Reisimine ja transport | 1,809 | — |
| Toidukauplused ja supermarketid | 1,547 | — |
| Ettevõtte juhtimine | 1,465 | 17 year |
| Rõivakauplused | 1,347 | — |
| Haridus | 1,208 | 34 year |
| Religioon | 1,085 | — |
| Ilusalongi | 807 | — |
Manado faktid
| ala | 426.4 km² |
| Rahvastik | 651 649 |
| Meeste populatsioon | 328 224 (50.4%) |
| Naisrahvastik | 323 425 (49.6%) |
| Rahvastiku muutus (1975 to 2020) | +126.2% |
| Rahvastiku muutus (2000 to 2020) | +33.8% |
| Mediaanvanus | 28.2 aastat (Mehed: 27.8, Naised: 28.7) |
| SKT elaniku kohta (PPP) | $14 526 (2022) |
| Suunakoodid | 43 |
| Piirkonnad | Pinaesaan, Wenang, Wenang Utara, Wenang, Manado, Teling Atas, Wanea, Malalayang Satu, Malalayang |
| Kohalik Aeg | |
| Ajatsoon | Kesk-Indoneesia aeg |
| Laius- ja pikkuskraad | 1.48218, 124.84892 |
| Postiindeksid | 95111, 95112, 95113, 95114, 95115, More |
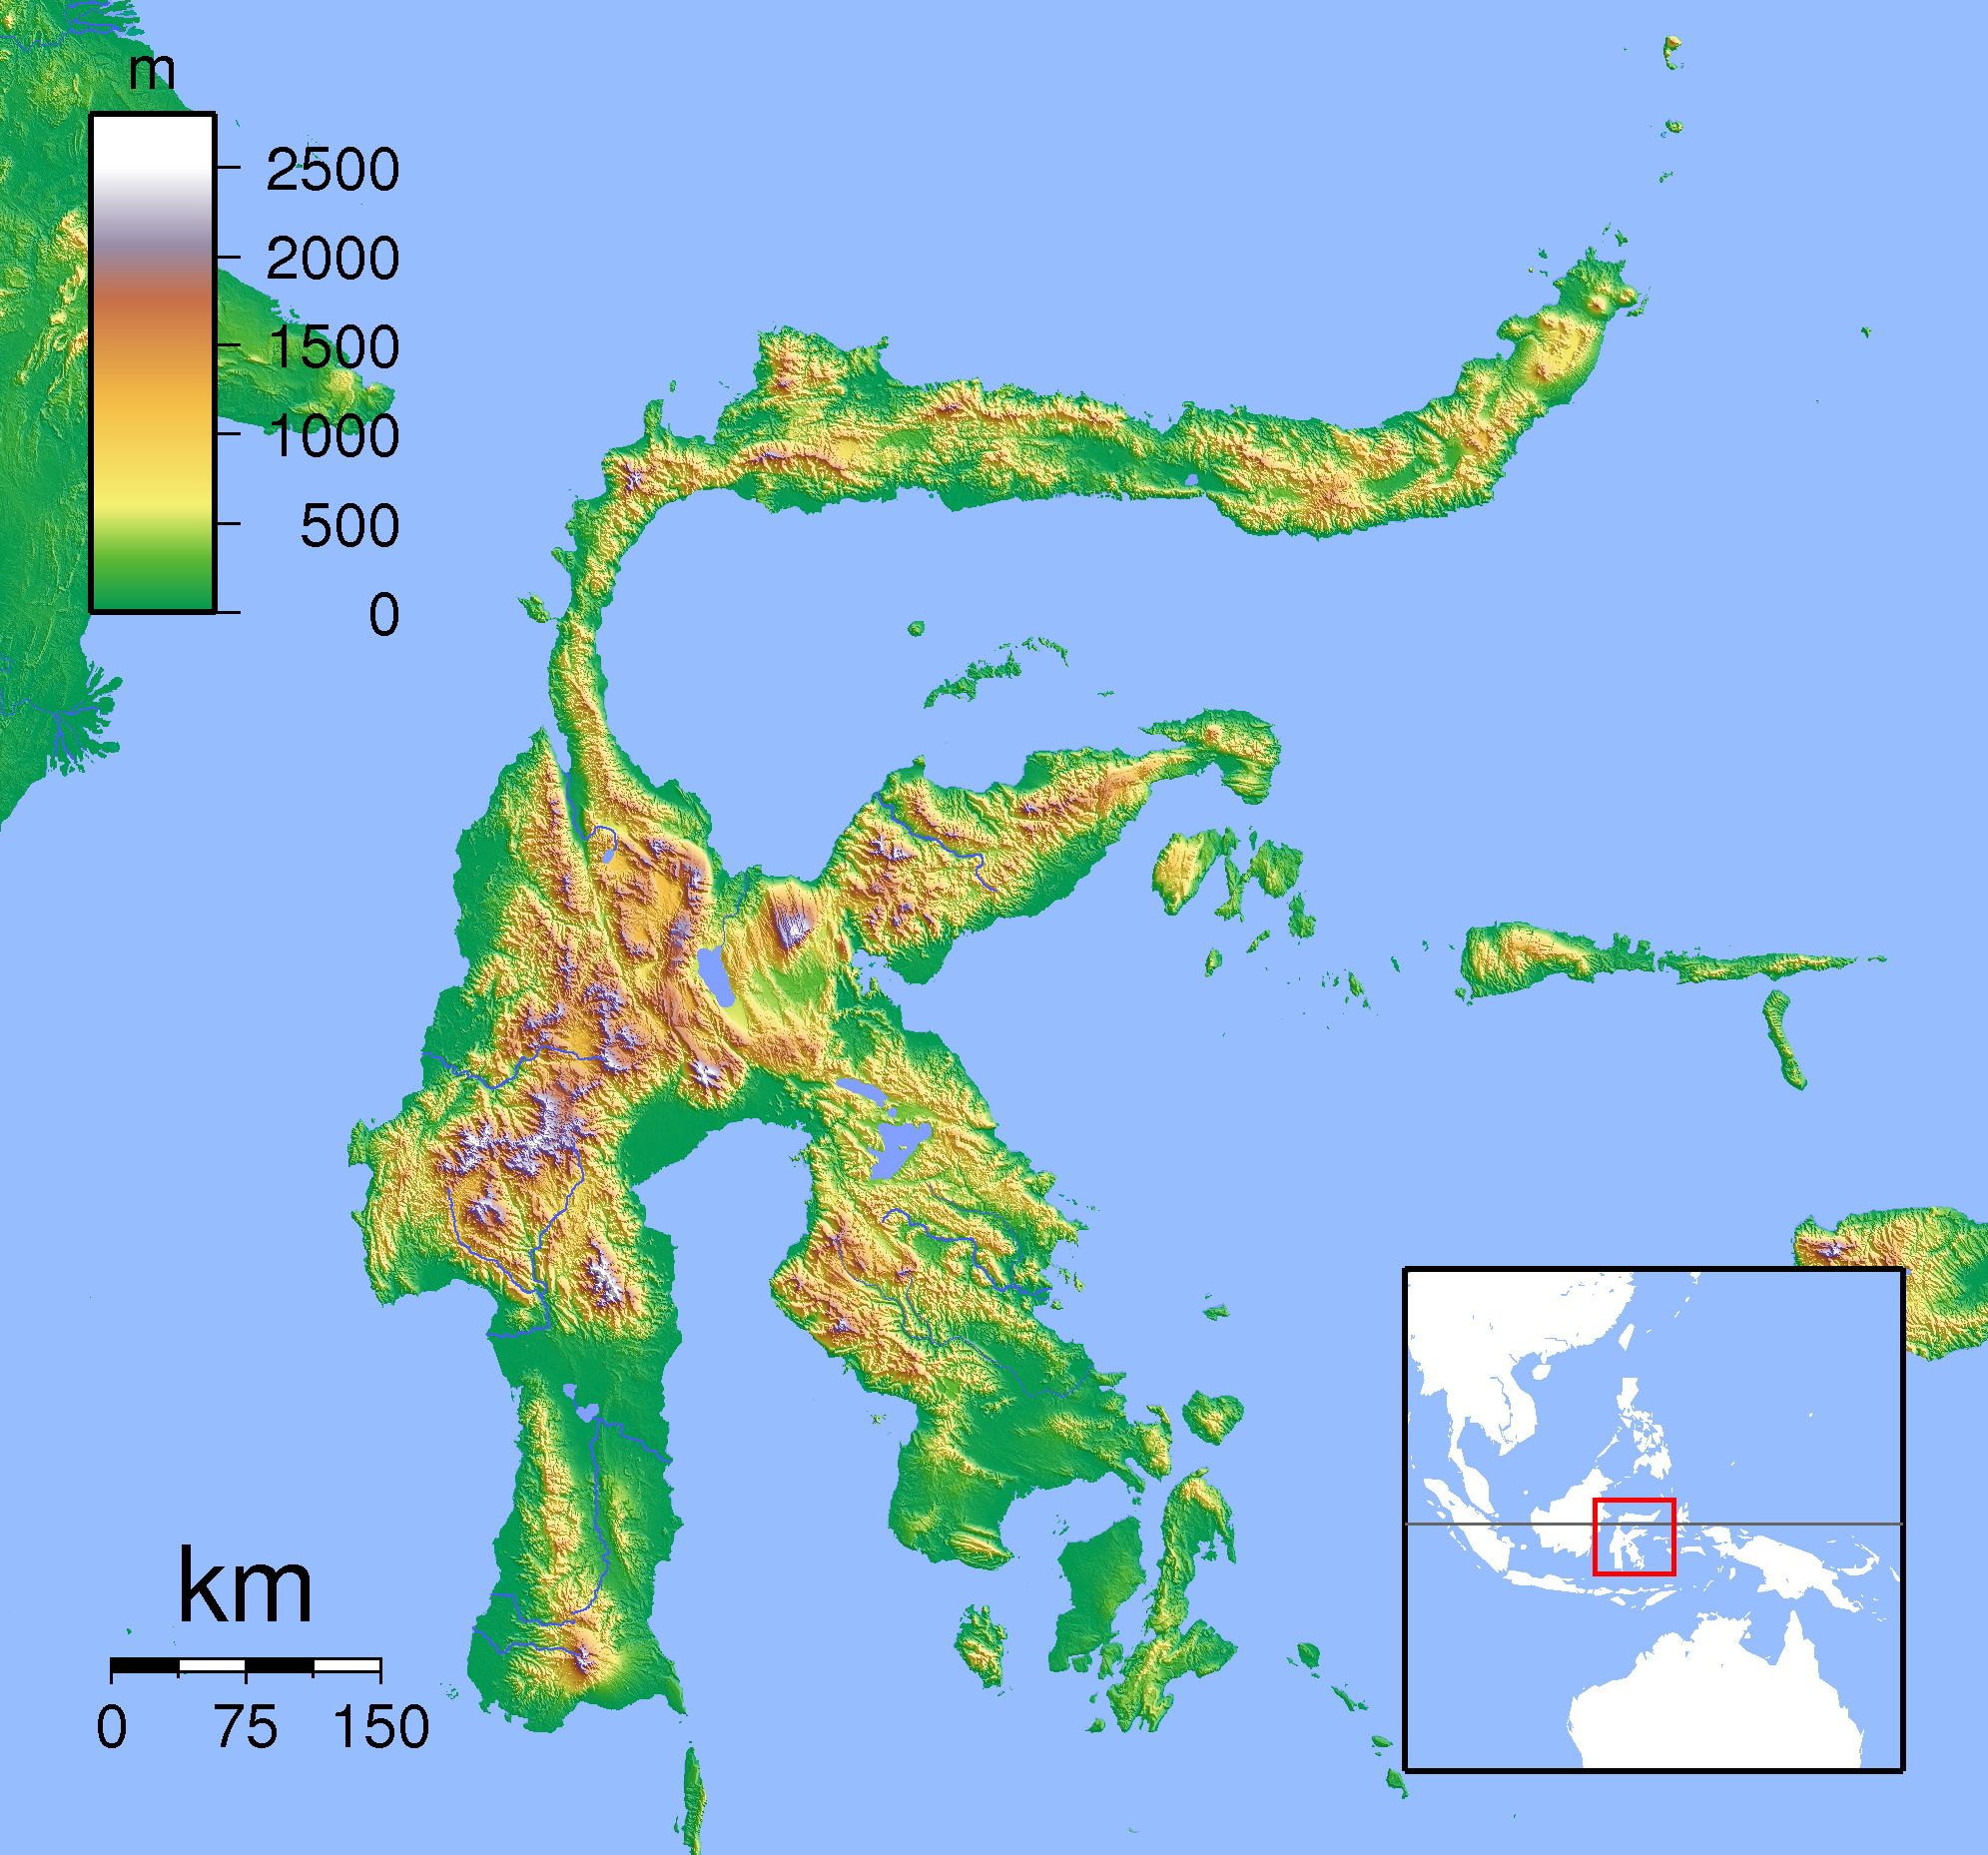
Asukoha Manado kaart
Interaktiivne kaart
Manado rahvastik
Aastad 1975 kuni 2030
| Data | 1975 | 1990 | 2000 | 2015 | 2020 | 2025* | 2030* |
|---|---|---|---|---|---|---|---|
| Rahvastik | 288 070 | 409 979 | 486 854 | 605 767 | 651 649 | 689 068 | 737 478 |
| Rahvastiku tihedus | 675,5 / km² | 961,4 / km² | 1141,7 / km² | 1420,5 / km² | 1528,1 / km² | 1615,9 / km² | 1729,4 / km² |
Manado rahvastiku muutus aastast 2000 aastani 2020
Kasv 33.8% aastast 2000 aastani 2020
| Asukoht | Muutus alates 1975 | Muutus alates 1990 | Muutus alates 2000 |
|---|---|---|---|
| Manado | +126.2% | +58.9% | +33.8% |
| Sulawesi Utara | — | — | — |
| Indoneesia | — | — | — |
Manado mediaanvanus
Mediaanvanus: 28.2 aastat
| Asukoht | Mediaanvanus | Keskmine vanus (naine) | Keskmine vanus (mees) |
|---|---|---|---|
| Manado | 28.2 yrs | 28.7 yrs | 27.8 yrs |
| Sulawesi Utara | 29.1 yrs | 29.5 yrs | 28.7 yrs |
| Indoneesia | 27.2 yrs | 27.5 yrs | 26.9 yrs |
Manado rahvastikutihedus
Rahvastikutihedus: 1528 / km²
| Asukoht | Rahvastik | ala | Tihedus |
|---|---|---|---|
| Manado | 651 649 | 426,4 km² | 1528 / km² |
| Sulawesi Utara | 2,4 million | 14 665,5 km² | 161 / km² |
| Indoneesia | 252,8 million | 1 893 657,8 km² | 134 / km² |
Manado ajalooline ja prognoositud rahvastik
Hinnanguline rahvastik aastast 1830 aastani 2100
- JRC (European Commission's Joint Research Centre) töötama GHS built-up grid
- CIESIN (Center for International Earth Science Information Network)
- [Link] Klein Goldewijk, K., Beusen, A., Doelman, J., and Stehfest, E.: Anthropogenic land use estimates for the Holocene – HYDE 3.2, Earth Syst. Sci. Data, 9, 927–953, https://doi.org/10.5194/essd-9-927-2017, 2017.
Linnaosad piirkonnas Manado
Ettevõtete osakaal linnaosade kaupa piirkonnas Manado
Suunakoodid
Suunakoodide protsent, mida kasutavad ettevõtted asukohas Manado
Postiindeksid
Ettevõtete osakaal sihtnumbrite kaupa piirkonnas Manado
Hinnajaotus
Asukoha Manado ettevõtete jaotus hinna alusel
Inimarengu indeks (HDI)
Eeldatava eluea, hariduse ja elaniku sissetuleku statistiline liitindeks.
Manado sisemajanduse koguprodukt (SKT)
SKT elaniku kohta, PPP (2017. aasta püsivates rahvusvahelistes dollarites)
| Data | 1990 | 1995 | 2000 | 2005 | 2010 | 2015 | 2020 | 2022 |
|---|---|---|---|---|---|---|---|---|
| SKT elaniku kohta | $4897 | $6738 | $6390 | $7121 | $9766 | $11 847 | $15 154 | $14 526 |
| SKT kokku | $2,2 mld | $3,4 mld | $3,5 mld | $4,1 mld | $5,8 mld | $7,2 mld | $9,9 mld | $9,4 mld |
Manado CO2 heitkogused
Süsinikdioksiidi (CO2) heide inimese kohta tonnides aastas
| Asukoht | CO2 heitkogused | CO2 emissioon elaniku kohta | CO2 heite intensiivsus |
|---|---|---|---|
| Manado | 885,977 tn | 1.36 tn | 2,077.6 tons/km² |
| Sulawesi Utara | 4,296,994 tn | 1.82 tn | 293 tons/km² |
| Indoneesia | 478,610,416 tn | 1.89 tn | 252.7 tons/km² |
| 2013. aasta CO2 heitkogused (tonni/aastas) | 885,977 tn |
| 2013. aasta CO2 heitkogused (tonni/aastas) inimese kohta | 1.36 tn |
| 2013. aasta CO2 heitkoguste intensiivsus (tonni/km²/aastas) | 2,077.6 tons/km² |
Looduslike ohtude oht
Suhteline risk 10st
| Oht | Riski tase |
|---|---|
| Põud | Kõrge (7.1) |
| Üleujutus | Keskmine (4) |
| Maavärin | Keskmine (5.3) |
| Maalihke | Kõrge (9) |
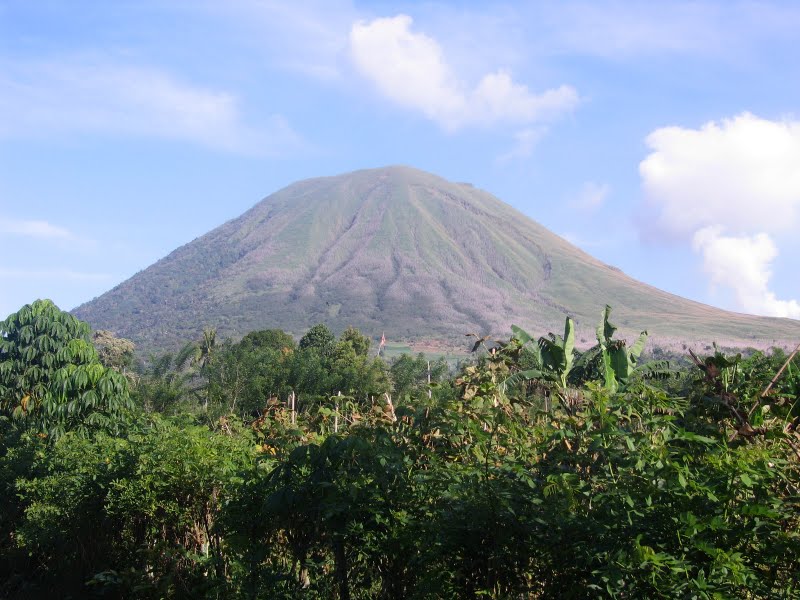
| Vulkaan | Kõrge (9) |
* Risk, eriti üleujutuse või maalihke korral, ei pruugi olla kogu piirkonnas.
- Dilley, M., R.S. Chen, U. Deichmann, A.L. Lerner-Lam, M. Arnold, J. Agwe, P. Buys, O. Kjekstad, B. Lyon, and G. Yetman. 2005. Natural Disaster Hotspots: A Global Risk Analysis. Washington, D.C.: World Bank. https://doi.org/10.1596/0-8213-5930-4.
- Center for Hazards and Risk Research - CHRR - Columbia University, Center for International Earth Science Information Network - CIESIN - Columbia University, and Norwegian Geotechnical Institute - NGI. 2005. Global Landslide Hazard Distribution. Palisades, NY: NASA Socioeconomic Data and Applications Center (SEDAC). https://doi.org/10.7927/H4P848VZ.
- Center for Hazards and Risk Research - CHRR - Columbia University, Center for International Earth Science Information Network - CIESIN - Columbia University, and International Research Institute for Climate and Society - IRI - Columbia University. 2005. Global Drought Hazard Frequency and Distribution. Palisades, NY: NASA Socioeconomic Data and Applications Center (SEDAC). https://doi.org/10.7927/H4VX0DFT.
- Center for Hazards and Risk Research - CHRR - Columbia University, Center for International Earth Science Information Network - CIESIN - Columbia University. 2005. Global Flood Hazard Frequency and Distribution. Palisades, NY: NASA Socioeconomic Data and Applications Center (SEDAC). https://doi.org/10.7927/H4668B3D.
- Center for Hazards and Risk Research - CHRR - Columbia University, Center for International Earth Science Information Network - CIESIN - Columbia University. 2005. Global Volcano Hazard Frequency and Distribution. Palisades, NY: NASA Socioeconomic Data and Applications Center (SEDAC). https://doi.org/10.7927/H4BR8Q45.
- Center for Hazards and Risk Research - CHRR - Columbia University, Center for International Earth Science Information Network - CIESIN - Columbia University. 2005. Global Earthquake Hazard Distribution - Peak Ground Acceleration. Palisades, NY: NASA Socioeconomic Data and Applications Center (SEDAC). https://doi.org/10.7927/H4BZ63ZS.
Viimased lähedal asuvad maavärinad
Magnituud 3,0 ja suurem
| Kuupäev▼ | Aeg↕ | Magnitude↕ | Distance↕ | Sügavus↕ | Asukoht↕ | Link |
|---|---|---|---|---|---|---|
| 4/18/19 | 9:31 PM | 4.5 | 45.6 km | 170,050 m | 25km N of Bitung, Indonesia | usgs.gov |
| 10/13/18 | 4:34 AM | 5.2 | 51.4 km | 97,150 m | 16km ENE of Bitung, Indonesia | usgs.gov |
| 7/13/18 | 2:29 AM | 4.6 | 38.7 km | 227,990 m | 36km W of Tomohon, Indonesia | usgs.gov |
| 4/2/18 | 7:23 PM | 4.6 | 20.3 km | 193,710 m | 17km NNW of Laikit, Laikit II (Dimembe), Indonesia | usgs.gov |
| 2/20/18 | 9:29 AM | 4.8 | 53.4 km | 220,060 m | 53km W of Manado, Indonesia | usgs.gov |
| 8/27/17 | 7:51 PM | 4.2 | 46.9 km | 235,650 m | 46km NNW of Manado, Indonesia | usgs.gov |
| 8/21/17 | 11:31 PM | 4.5 | 47.4 km | 134,190 m | 27km S of Tondano, Indonesia | usgs.gov |
| 7/19/17 | 5:04 PM | 4.9 | 46.2 km | 177,060 m | 45km N of Manado, Indonesia | usgs.gov |
| 10/10/16 | 8:24 AM | 4.1 | 16.1 km | 550,800 m | 15km N of Manado, Indonesia | usgs.gov |
| 9/27/16 | 9:35 AM | 4.1 | 15.9 km | 35,000 m | 6km WNW of Tomohon, Indonesia | usgs.gov |

Meie andmete kohta
Sellel lehel olevad andmed on hinnatud mitmete avalikult kättesaadavate tööriistade ja ressursside abil. Need on esitatud ilma garantiita ja võivad sisaldada ebatäpsusi. Kasutage omal vastutusel.