Kategooriad asukohas Sainthia
Tööstused
Ettevõtete jaotus tööstusharude kaupa piirkonnas Sainthia
| Tööstusharu kirjeldus | Asutuste arv |
|---|---|
| Ostlemine | 131 |
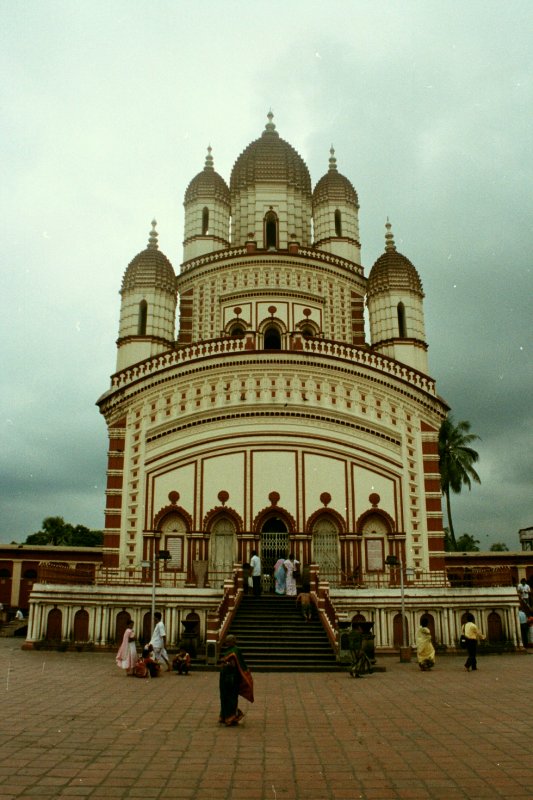
| Hindu temple | 89 |
| Rõivakauplused | 72 |
| Elektroonika kauplused | 57 |
| Restoranid | 48 |
| Muu ostlemine | 48 |
| Toidukauplused ja supermarketid | 46 |
| Rauakauplus | 45 |
| Apteegid ja narkootikumide kauplustes | 39 |
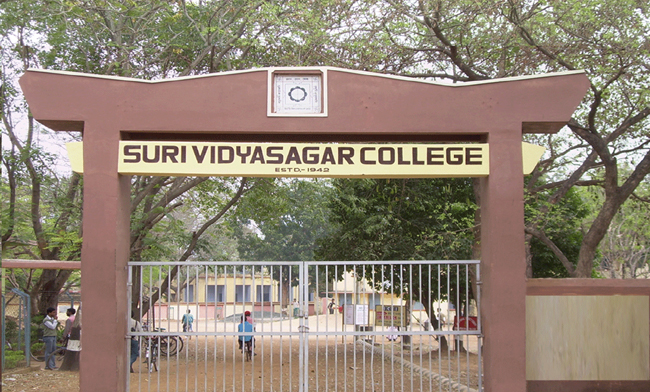
| Haridus | 39 |
Sainthia faktid
| ala | 4.9 km² |
| Rahvastik | 42 458 |
| Meeste populatsioon | 21 765 (51.3%) |
| Naisrahvastik | 20 693 (48.7%) |
| Rahvastiku muutus (1975 to 2020) | +442.4% |
| Rahvastiku muutus (2000 to 2020) | +117.6% |
| Mediaanvanus | 25.7 aastat (Mehed: 25.5, Naised: 25.9) |
| SKT elaniku kohta (PPP) | $5443 (2022) |
| Piirkonnad | Vivekananda Pally, 2B Extension, Netaji Pally |
| Kohalik Aeg | |
| Ajatsoon | India aeg |
| Laius- ja pikkuskraad | 23.94826, 87.68045 |
Asukoha Sainthia kaart
Interaktiivne kaart
Sainthia rahvastik
Aastad 1975 kuni 2030
| Data | 1975 | 1990 | 2000 | 2015 | 2020 | 2025* | 2030* |
|---|---|---|---|---|---|---|---|
| Rahvastik | 7828 | 16 006 | 19 513 | 19 189 | 42 458 | 41 748 | 41 456 |
| Rahvastiku tihedus | 1605,7 / km² | 3283,3 / km² | 4002,7 / km² | 3936,2 / km² | 8709,3 / km² | 8563,7 / km² | 8503,8 / km² |
Sainthia rahvastiku muutus aastast 2000 aastani 2020
Kasv 117.6% aastast 2000 aastani 2020
| Asukoht | Muutus alates 1975 | Muutus alates 1990 | Muutus alates 2000 |
|---|---|---|---|
| Sainthia | +442.4% | +165.3% | +117.6% |
| Lääne-Bengali osariik | — | — | — |
| India | — | — | — |
Sainthia mediaanvanus
Mediaanvanus: 25.7 aastat
| Asukoht | Mediaanvanus | Keskmine vanus (naine) | Keskmine vanus (mees) |
|---|---|---|---|
| Sainthia | 25.7 yrs | 25.9 yrs | 25.5 yrs |
| Lääne-Bengali osariik | 26.9 yrs | 26.8 yrs | 27 yrs |
| India | 24.9 yrs | 25.4 yrs | 24.5 yrs |
Sainthia rahvastikutihedus
Rahvastikutihedus: 8709 / km²
| Asukoht | Rahvastik | ala | Tihedus |
|---|---|---|---|
| Sainthia | 42 458 | 4,875 km² | 8709 / km² |
| Lääne-Bengali osariik | 97 million | 85 313,5 km² | 1137 / km² |
| India | 1307 million | 3 083 563,4 km² | 424 / km² |
Sainthia ajalooline ja prognoositud rahvastik
Hinnanguline rahvastik aastast 500 aastani 2100
- JRC (European Commission's Joint Research Centre) töötama GHS built-up grid
- CIESIN (Center for International Earth Science Information Network)
- [Link] Klein Goldewijk, K., Beusen, A., Doelman, J., and Stehfest, E.: Anthropogenic land use estimates for the Holocene – HYDE 3.2, Earth Syst. Sci. Data, 9, 927–953, https://doi.org/10.5194/essd-9-927-2017, 2017.
Suunakoodid
Suunakoodide protsent, mida kasutavad ettevõtted asukohas Sainthia
Inimarengu indeks (HDI)
Eeldatava eluea, hariduse ja elaniku sissetuleku statistiline liitindeks.
Sainthia sisemajanduse koguprodukt (SKT)
SKT elaniku kohta, PPP (2017. aasta püsivates rahvusvahelistes dollarites)
| Data | 1990 | 1995 | 2000 | 2005 | 2010 | 2015 | 2020 | 2022 |
|---|---|---|---|---|---|---|---|---|
| SKT elaniku kohta | $1471 | $1414 | $1909 | $2427 | $2821 | $3277 | $4180 | $5443 |
| SKT kokku | $231,1 mln | $244,5 mln | $361 mln | $499,2 mln | $620,8 mln | $760,5 mln | $999,3 mln | $1,3 mld |
Sainthia CO2 heitkogused
Süsinikdioksiidi (CO2) heide inimese kohta tonnides aastas
| Asukoht | CO2 heitkogused | CO2 emissioon elaniku kohta | CO2 heite intensiivsus |
|---|---|---|---|
| Sainthia | 57,604 tn | 1.36 tn | 11,816.2 tons/km² |
| Lääne-Bengali osariik | 140,075,161 tn | 1.44 tn | 1,641.9 tons/km² |
| India | 1,928,568,344 tn | 1.48 tn | 625.4 tons/km² |
| 2013. aasta CO2 heitkogused (tonni/aastas) | 57,604 tn |
| 2013. aasta CO2 heitkogused (tonni/aastas) inimese kohta | 1.36 tn |
| 2013. aasta CO2 heitkoguste intensiivsus (tonni/km²/aastas) | 11,816.2 tons/km² |
Looduslike ohtude oht
Suhteline risk 10st
| Oht | Riski tase |
|---|---|
| Põud | Kõrge (10) |
| Üleujutus | Kõrge (10) |
| Maavärin | Madal (2) |
| Tsüklon | Keskmine (5) |
* Risk, eriti üleujutuse või maalihke korral, ei pruugi olla kogu piirkonnas.
- Dilley, M., R.S. Chen, U. Deichmann, A.L. Lerner-Lam, M. Arnold, J. Agwe, P. Buys, O. Kjekstad, B. Lyon, and G. Yetman. 2005. Natural Disaster Hotspots: A Global Risk Analysis. Washington, D.C.: World Bank. https://doi.org/10.1596/0-8213-5930-4.
- Center for Hazards and Risk Research - CHRR - Columbia University, Center for International Earth Science Information Network - CIESIN - Columbia University, International Bank for Reconstruction and Development - The World Bank, and United Nations Environment Programme Global Resource Information Database Geneva - UNEP/GRID-Geneva. 2005. Global Cyclone Hazard Frequency and Distribution. Palisades, NY: NASA Socioeconomic Data and Applications Center (SEDAC). https://doi.org/10.7927/H4CZ353K.
- Center for Hazards and Risk Research - CHRR - Columbia University, Center for International Earth Science Information Network - CIESIN - Columbia University, and International Research Institute for Climate and Society - IRI - Columbia University. 2005. Global Drought Hazard Frequency and Distribution. Palisades, NY: NASA Socioeconomic Data and Applications Center (SEDAC). https://doi.org/10.7927/H4VX0DFT.
- Center for Hazards and Risk Research - CHRR - Columbia University, Center for International Earth Science Information Network - CIESIN - Columbia University. 2005. Global Flood Hazard Frequency and Distribution. Palisades, NY: NASA Socioeconomic Data and Applications Center (SEDAC). https://doi.org/10.7927/H4668B3D.
- Center for Hazards and Risk Research - CHRR - Columbia University, Center for International Earth Science Information Network - CIESIN - Columbia University. 2005. Global Earthquake Hazard Distribution - Peak Ground Acceleration. Palisades, NY: NASA Socioeconomic Data and Applications Center (SEDAC). https://doi.org/10.7927/H4BZ63ZS.
Viimased lähedal asuvad maavärinad
Magnituud 3,0 ja suurem
| Kuupäev▼ | Aeg↕ | Magnitude↕ | Distance↕ | Sügavus↕ | Asukoht↕ | Link |
|---|---|---|---|---|---|---|
| 11/8/08 | 4:51 PM | 4.2 | 47.6 km | 10,000 m | West Bengal, India | usgs.gov |
| 7/5/08 | 4:55 PM | 4.2 | 94.9 km | 35,000 m | India-Bangladesh border region | usgs.gov |
| 2/6/08 | 6:09 AM | 4.3 | 81.4 km | 10,000 m | West Bengal, India | usgs.gov |

Meie andmete kohta
Sellel lehel olevad andmed on hinnatud mitmete avalikult kättesaadavate tööriistade ja ressursside abil. Need on esitatud ilma garantiita ja võivad sisaldada ebatäpsusi. Kasutage omal vastutusel.