Kategooriad asukohas Teheran
Tööstused
Ettevõtete jaotus tööstusharude kaupa piirkonnas Teheran
| Tööstusharu kirjeldus | Asutuste arv | Ettevõtluse keskmine vanus |
|---|---|---|
| Ettevõtte juhtimine | 27,300 | 28 year |
| Ostlemine | 26,272 | 27 year |
| Restoranid | 12,921 | 13 year |
| Elektroonika kauplused | 10,158 | 25 year |
| Toidukauplused ja supermarketid | 8,758 | — |
| Haridus | 8,604 | 42 year |
| Rõivakauplused | 8,336 | 28 year |
| Kinnisvara | 8,154 | 22 year |
| Autoremont | 7,395 | — |
| Kohvikud | 7,064 | — |
| Tervis ja meditsiin | 6,803 | — |
| Ilusalongi | 5,270 | — |
| Korterid | 5,208 | — |
Teheran faktid
| ala | 1654.1 km² |
| Rahvastik | 7 563 713 |
| Meeste populatsioon | 3 810 629 (50.4%) |
| Naisrahvastik | 3 753 084 (49.6%) |
| Rahvastiku muutus (1975 to 2020) | +3177.1% |
| Rahvastiku muutus (2000 to 2020) | +15.0% |
| Mediaanvanus | 27.9 aastat (Mehed: 27.8, Naised: 28) |
| SKT elaniku kohta (PPP) | $21 466 (2022) |
| Suunakoodid | 21 |
| Piirkonnad | District 6, District 3, District 2, District 1, District 7 |
| Kohalik Aeg | |
| Ajatsoon | Iraani standardaeg |
| Laius- ja pikkuskraad | 35.69439, 51.42151 |
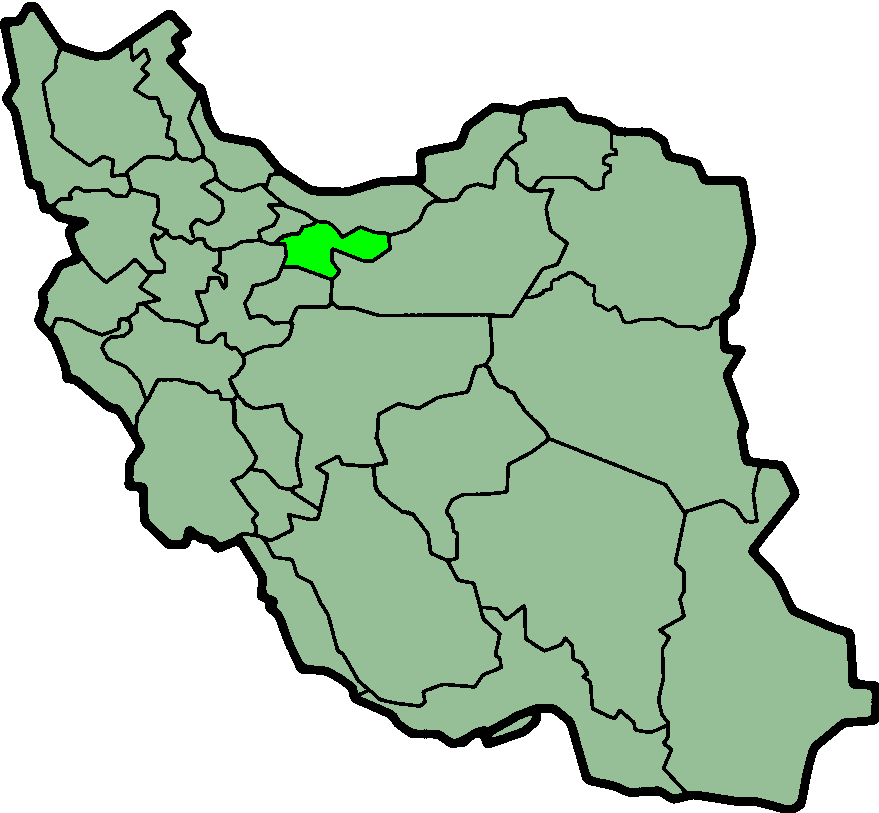
Asukoha Teheran kaart
Interaktiivne kaart
Teheran rahvastik
Aastad 1975 kuni 2030
| Data | 1975 | 1990 | 2000 | 2015 | 2020 | 2025* | 2030* |
|---|---|---|---|---|---|---|---|
| Rahvastik | 230 806 | 3 735 528 | 6 576 101 | 8 776 770 | 7 563 713 | 8 044 958 | 8 501 550 |
| Rahvastiku tihedus | 139,5 / km² | 2258,3 / km² | 3975,6 / km² | 5306 / km² | 4572,6 / km² | 4863,6 / km² | 5139,6 / km² |
Teheran rahvastiku muutus aastast 2000 aastani 2020
Kasv 15% aastast 2000 aastani 2020
| Asukoht | Muutus alates 1975 | Muutus alates 1990 | Muutus alates 2000 |
|---|---|---|---|
| Teheran | +3177.1% | +102.5% | +15% |
| Ostān-e Tehrān | — | — | — |
| Iraan | — | — | — |
Teheran mediaanvanus
Mediaanvanus: 27.9 aastat
| Asukoht | Mediaanvanus | Keskmine vanus (naine) | Keskmine vanus (mees) |
|---|---|---|---|
| Teheran | 27.9 yrs | 28 yrs | 27.8 yrs |
| Ostān-e Tehrān | 27.9 yrs | 28 yrs | 27.8 yrs |
| Iraan | 27.9 yrs | 28 yrs | 27.8 yrs |
Teheran rahvastikutihedus
Rahvastikutihedus: 4573 / km²
| Asukoht | Rahvastik | ala | Tihedus |
|---|---|---|---|
| Teheran | 7,6 million | 1654,1 km² | 4573 / km² |
| Ostān-e Tehrān | 12,6 million | 13 711,4 km² | 922 / km² |
| Iraan | 79,1 million | 1 623 090,1 km² | 48,7 / km² |
Teheran ajalooline ja prognoositud rahvastik
Hinnanguline rahvastik aastast 1970 aastani 2100
- JRC (European Commission's Joint Research Centre) töötama GHS built-up grid
- CIESIN (Center for International Earth Science Information Network)
- [Link] Klein Goldewijk, K., Beusen, A., Doelman, J., and Stehfest, E.: Anthropogenic land use estimates for the Holocene – HYDE 3.2, Earth Syst. Sci. Data, 9, 927–953, https://doi.org/10.5194/essd-9-927-2017, 2017.
Linnaosad piirkonnas Teheran
Ettevõtete osakaal linnaosade kaupa piirkonnas Teheran
Suunakoodid
Suunakoodide protsent, mida kasutavad ettevõtted asukohas Teheran
Hinnajaotus
Asukoha Teheran ettevõtete jaotus hinna alusel
Inimarengu indeks (HDI)
Eeldatava eluea, hariduse ja elaniku sissetuleku statistiline liitindeks.
Teheran sisemajanduse koguprodukt (SKT)
SKT elaniku kohta, PPP (2017. aasta püsivates rahvusvahelistes dollarites)
| Data | 1990 | 1995 | 2000 | 2005 | 2010 | 2015 | 2020 | 2022 |
|---|---|---|---|---|---|---|---|---|
| SKT elaniku kohta | $14 352 | $14 438 | $15 137 | $18 149 | $26 090 | $20 040 | $20 035 | $21 466 |
| SKT kokku | $65 mld | $66,9 mld | $74,5 mld | $93,7 mld | $146,8 mld | $122,2 mld | $136,6 mld | $149,1 mld |
Teheran CO2 heitkogused
Süsinikdioksiidi (CO2) heide inimese kohta tonnides aastas
| Asukoht | CO2 heitkogused | CO2 emissioon elaniku kohta | CO2 heite intensiivsus |
|---|---|---|---|
| Teheran | 74,553,492 tn | 9.86 tn | 45,071.3 tons/km² |
| Ostān-e Tehrān | 125,855,629 tn | 9.96 tn | 9,178.9 tons/km² |
| Iraan | 601,639,824 tn | 7.6 tn | 370.7 tons/km² |
| 2013. aasta CO2 heitkogused (tonni/aastas) | 74,553,492 tn |
| 2013. aasta CO2 heitkogused (tonni/aastas) inimese kohta | 9.86 tn |
| 2013. aasta CO2 heitkoguste intensiivsus (tonni/km²/aastas) | 45,071.3 tons/km² |
Looduslike ohtude oht
Suhteline risk 10st
| Oht | Riski tase |
|---|---|
| Põud | Keskmine (5) |
| Üleujutus | Keskmine (7) |
| Maavärin | Kõrge (8.7) |
| Maalihke | Keskmine (6) |
* Risk, eriti üleujutuse või maalihke korral, ei pruugi olla kogu piirkonnas.
- Dilley, M., R.S. Chen, U. Deichmann, A.L. Lerner-Lam, M. Arnold, J. Agwe, P. Buys, O. Kjekstad, B. Lyon, and G. Yetman. 2005. Natural Disaster Hotspots: A Global Risk Analysis. Washington, D.C.: World Bank. https://doi.org/10.1596/0-8213-5930-4.
- Center for Hazards and Risk Research - CHRR - Columbia University, Center for International Earth Science Information Network - CIESIN - Columbia University, and Norwegian Geotechnical Institute - NGI. 2005. Global Landslide Hazard Distribution. Palisades, NY: NASA Socioeconomic Data and Applications Center (SEDAC). https://doi.org/10.7927/H4P848VZ.
- Center for Hazards and Risk Research - CHRR - Columbia University, Center for International Earth Science Information Network - CIESIN - Columbia University, and International Research Institute for Climate and Society - IRI - Columbia University. 2005. Global Drought Hazard Frequency and Distribution. Palisades, NY: NASA Socioeconomic Data and Applications Center (SEDAC). https://doi.org/10.7927/H4VX0DFT.
- Center for Hazards and Risk Research - CHRR - Columbia University, Center for International Earth Science Information Network - CIESIN - Columbia University. 2005. Global Flood Hazard Frequency and Distribution. Palisades, NY: NASA Socioeconomic Data and Applications Center (SEDAC). https://doi.org/10.7927/H4668B3D.
- Center for Hazards and Risk Research - CHRR - Columbia University, Center for International Earth Science Information Network - CIESIN - Columbia University. 2005. Global Earthquake Hazard Distribution - Peak Ground Acceleration. Palisades, NY: NASA Socioeconomic Data and Applications Center (SEDAC). https://doi.org/10.7927/H4BZ63ZS.
Viimased lähedal asuvad maavärinad
Magnituud 3,0 ja suurem
| Kuupäev▼ | Aeg↕ | Magnitude↕ | Distance↕ | Sügavus↕ | Asukoht↕ | Link |
|---|---|---|---|---|---|---|
| 4/1/18 | 6:26 PM | 4 | 89.8 km | 10,000 m | 23km NNE of Istgah-e Garmsar, Iran | usgs.gov |
| 12/26/17 | 9:24 PM | 4 | 15.2 km | 10,000 m | 15km W of Tehran, Iran | usgs.gov |
| 12/20/17 | 7:57 PM | 4.9 | 41.9 km | 10,000 m | 2km SW of Malard, Iran | usgs.gov |
| 8/16/14 | 11:55 PM | 4.1 | 84.3 km | 8,000 m | 33km NE of Damavand, Iran | usgs.gov |
| 5/10/14 | 10:04 PM | 4.1 | 87.4 km | 10,000 m | 39km SSW of Amol, Iran | usgs.gov |
| 8/17/12 | 8:31 PM | 3.8 | 44 km | 7,300 m | northern Iran | usgs.gov |
| 2/10/12 | 8:59 AM | 4.7 | 91.2 km | 14,300 m | northern Iran | usgs.gov |
| 2/20/11 | 11:22 AM | 4.2 | 47.2 km | 7,000 m | northern Iran | usgs.gov |
| 6/4/07 | 8:04 AM | 3.9 | 81.1 km | 3,900 m | northern Iran | usgs.gov |
| 12/20/06 | 4:39 AM | 4.2 | 41.8 km | 14,100 m | northern Iran | usgs.gov |


Meie andmete kohta
Sellel lehel olevad andmed on hinnatud mitmete avalikult kättesaadavate tööriistade ja ressursside abil. Need on esitatud ilma garantiita ja võivad sisaldada ebatäpsusi. Kasutage omal vastutusel.