Aso faktid
| ala | 0.1 km² |
| Mediaanvanus | 53.7 aastat (Mehed: 51.2, Naised: 55.9) |
| Kohalik Aeg | |
| Ajatsoon | Jaapani standardaeg |
| Laius- ja pikkuskraad | 32.93726, 131.08008 |
Asukoha Aso kaart
Interaktiivne kaart
Aso rahvastik
Aastad 1975 kuni 2030
| Data | 1975 | 1990 | 2000 | 2015 | 2020 | 2025* | 2030* |
|---|---|---|---|---|---|---|---|
| Rahvastik | 0 | 0 | 0 | 0 | 0 | 0 | 0 |
| Rahvastiku tihedus | 0 / km² | 0 / km² | 0 / km² | 0 / km² | 0 / km² | 0 / km² | 0 / km² |
Aso rahvastiku muutus aastast 2000 aastani 2000
| Asukoht | Muutus alates 1975 | Muutus alates 1990 |
|---|---|---|
| Aso | — | — |
| Kumamoto prefektuur | +5.6% | -0.2% |
| Jaapan | +12.9% | +2.7% |
Aso mediaanvanus
Mediaanvanus: 53.7 aastat
| Asukoht | Mediaanvanus | Keskmine vanus (naine) | Keskmine vanus (mees) |
|---|---|---|---|
| Aso | 53.7 yrs | 55.9 yrs | 51.2 yrs |
| Kumamoto prefektuur | 47.8 yrs | 49.9 yrs | 45.5 yrs |
| Jaapan | 45.1 yrs | 46.9 yrs | 43.5 yrs |
Kumamoto prefektuur rahvastikutihedus
Rahvastikutihedus: 235 / km²
| Asukoht | Rahvastik | ala | Tihedus |
|---|---|---|---|
| Kumamoto prefektuur | 1,7 million | 7397,2 km² | 235 / km² |
| Jaapan | 122,9 million | 373 410,9 km² | 329 / km² |
Aso ajalooline ja prognoositud rahvastik
Hinnanguline rahvastik aastast 1975 aastani 2030
- JRC (European Commission's Joint Research Centre) töötama GHS built-up grid
- CIESIN (Center for International Earth Science Information Network)
- [Link] Klein Goldewijk, K., Beusen, A., Doelman, J., and Stehfest, E.: Anthropogenic land use estimates for the Holocene – HYDE 3.2, Earth Syst. Sci. Data, 9, 927–953, https://doi.org/10.5194/essd-9-927-2017, 2017.
Inimarengu indeks (HDI)
Eeldatava eluea, hariduse ja elaniku sissetuleku statistiline liitindeks.
Kumamoto prefektuur CO2 heitkogused
Süsinikdioksiidi (CO2) heide inimese kohta tonnides aastas
| Asukoht | CO2 heitkogused | CO2 emissioon elaniku kohta | CO2 heite intensiivsus |
|---|---|---|---|
| Kumamoto prefektuur | 3,205,723 tn | 1.85 tn | 433.4 tons/km² |
| Jaapan | 541,995,101 tn | 4.41 tn | 1,451.5 tons/km² |
| 2013. aasta CO2 heitkogused (tonni/aastas) | 3,205,723 tn |
| 2013. aasta CO2 heitkogused (tonni/aastas) inimese kohta | 1.85 tn |
| 2013. aasta CO2 heitkoguste intensiivsus (tonni/km²/aastas) | 433.4 tons/km² |
Looduslike ohtude oht
Suhteline risk 10st
| Oht | Riski tase |
|---|---|
| Üleujutus | Kõrge (8) |
| Maavärin | Kõrge (9) |
| Tsüklon | Kõrge (10) |
| Maalihke | Keskmine (7) |
| Vulkaan | Keskmine (4) |
* Risk, eriti üleujutuse või maalihke korral, ei pruugi olla kogu piirkonnas.
- Dilley, M., R.S. Chen, U. Deichmann, A.L. Lerner-Lam, M. Arnold, J. Agwe, P. Buys, O. Kjekstad, B. Lyon, and G. Yetman. 2005. Natural Disaster Hotspots: A Global Risk Analysis. Washington, D.C.: World Bank. https://doi.org/10.1596/0-8213-5930-4.
- Center for Hazards and Risk Research - CHRR - Columbia University, Center for International Earth Science Information Network - CIESIN - Columbia University, and Norwegian Geotechnical Institute - NGI. 2005. Global Landslide Hazard Distribution. Palisades, NY: NASA Socioeconomic Data and Applications Center (SEDAC). https://doi.org/10.7927/H4P848VZ.
- Center for Hazards and Risk Research - CHRR - Columbia University, Center for International Earth Science Information Network - CIESIN - Columbia University, International Bank for Reconstruction and Development - The World Bank, and United Nations Environment Programme Global Resource Information Database Geneva - UNEP/GRID-Geneva. 2005. Global Cyclone Hazard Frequency and Distribution. Palisades, NY: NASA Socioeconomic Data and Applications Center (SEDAC). https://doi.org/10.7927/H4CZ353K.
- Center for Hazards and Risk Research - CHRR - Columbia University, Center for International Earth Science Information Network - CIESIN - Columbia University. 2005. Global Flood Hazard Frequency and Distribution. Palisades, NY: NASA Socioeconomic Data and Applications Center (SEDAC). https://doi.org/10.7927/H4668B3D.
- Center for Hazards and Risk Research - CHRR - Columbia University, Center for International Earth Science Information Network - CIESIN - Columbia University. 2005. Global Volcano Hazard Frequency and Distribution. Palisades, NY: NASA Socioeconomic Data and Applications Center (SEDAC). https://doi.org/10.7927/H4BR8Q45.
- Center for Hazards and Risk Research - CHRR - Columbia University, Center for International Earth Science Information Network - CIESIN - Columbia University. 2005. Global Earthquake Hazard Distribution - Peak Ground Acceleration. Palisades, NY: NASA Socioeconomic Data and Applications Center (SEDAC). https://doi.org/10.7927/H4BZ63ZS.
Viimased lähedal asuvad maavärinad
Magnituud 3,0 ja suurem
| Kuupäev▼ | Aeg↕ | Magnitude↕ | Distance↕ | Sügavus↕ | Asukoht↕ | Link |
|---|---|---|---|---|---|---|
| 7/24/18 | 10:31 PM | 4.4 | 31.4 km | 8,020 m | 13km ESE of Kumamoto-shi, Japan | usgs.gov |
| 6/7/18 | 8:25 PM | 4.2 | 29.7 km | 119,510 m | 4km NNW of Takedamachi, Japan | usgs.gov |
| 7/1/17 | 3:58 PM | 4.5 | 4.2 km | 15,410 m | 25km ENE of Ozu, Japan | usgs.gov |
| 11/11/16 | 1:12 AM | 4.2 | 38.3 km | 10,000 m | 7km S of Kumamoto-shi, Japan | usgs.gov |
| 8/19/16 | 2:05 AM | 4.2 | 12.5 km | 10,000 m | 12km E of Kikuchi, Japan | usgs.gov |
| 8/1/16 | 5:20 AM | 4.1 | 39.6 km | 92,080 m | 26km S of Takedamachi, Japan | usgs.gov |
| 5/5/16 | 1:40 AM | 4.6 | 7.6 km | 13,650 m | 21km E of Kikuchi, Japan | usgs.gov |
| 5/5/16 | 1:31 AM | 4.6 | 11.3 km | 16,830 m | 15km E of Kikuchi, Japan | usgs.gov |
| 4/29/16 | 6:09 AM | 4.2 | 39.9 km | 2,350 m | 12km E of Tsukawaki, Japan | usgs.gov |
| 4/24/16 | 7:52 AM | 4.3 | 5.4 km | 10,000 m | 21km NE of Ozu, Japan | usgs.gov |
Aso
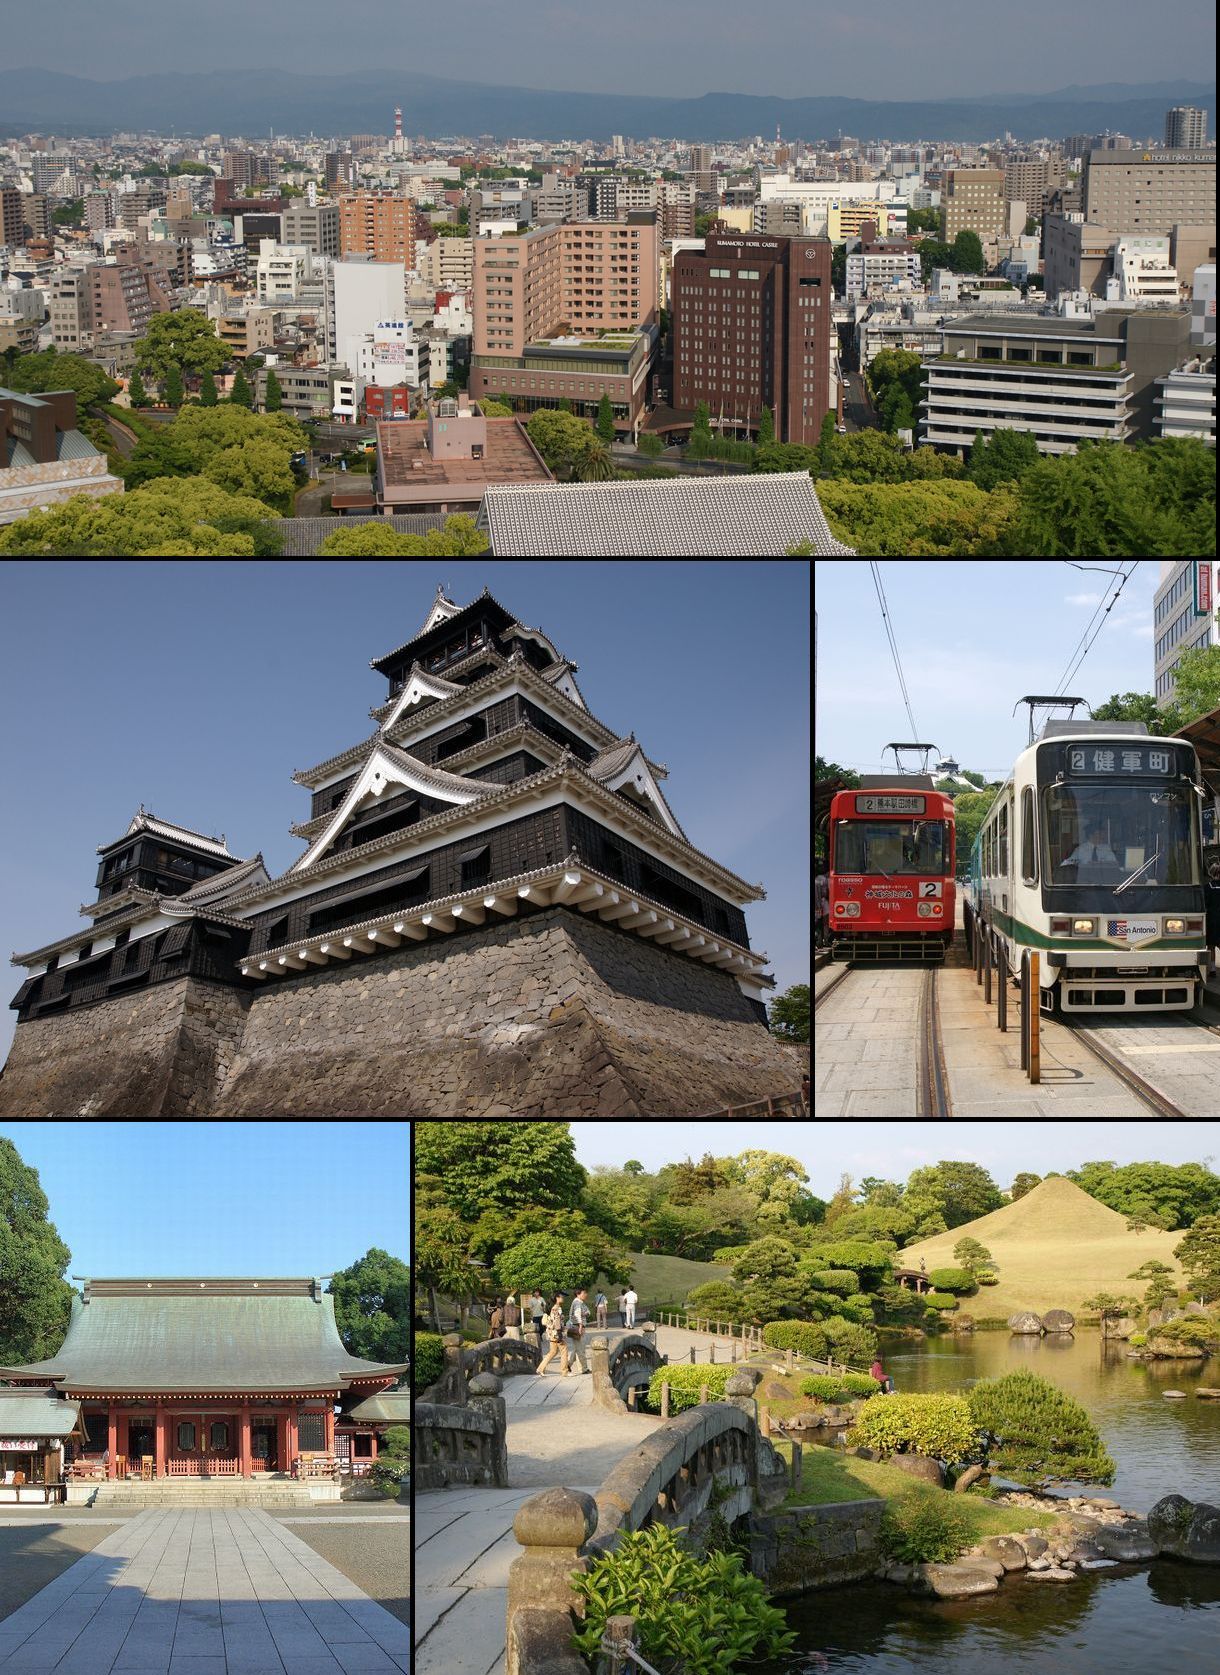
Aso (阿蘇市 Aso-shi) on linn Jaapanis Kumamoto prefektuuris. linn (shi) moodustati Aso ja Ichinomiya linna (chō) ning Namino küla liitmise teel. lähedal asub Aso Kujū rahvuspark. on pärit poliitik Toshikatsu Matsuoka. lõunapiiril asub Aso vulkaan.
Asukoha Aso Wikipedia leht


Meie andmete kohta
Sellel lehel olevad andmed on hinnatud mitmete avalikult kättesaadavate tööriistade ja ressursside abil. Need on esitatud ilma garantiita ja võivad sisaldada ebatäpsusi. Kasutage omal vastutusel.