Kategooriad asukohas La Foa
Tööstused
Ettevõtete jaotus tööstusharude kaupa piirkonnas La Foa
| Tööstusharu kirjeldus | Asutuste arv |
|---|---|
| Restoranid | 12 |
La Foa faktid
| ala | 427.3 km² |
| Rahvastik | 3905 |
| Meeste populatsioon | 1969 (50.4%) |
| Naisrahvastik | 1936 (49.6%) |
| Rahvastiku muutus (1975 to 2020) | +575.6% |
| Rahvastiku muutus (2000 to 2020) | +92.0% |
| Mediaanvanus | 31.9 aastat (Mehed: 31.1, Naised: 32.5) |
| Kohalik Aeg | |
| Ajatsoon | Uus-Kaledoonia standardaeg |
| Laius- ja pikkuskraad | -21.71079, 165.82764 |
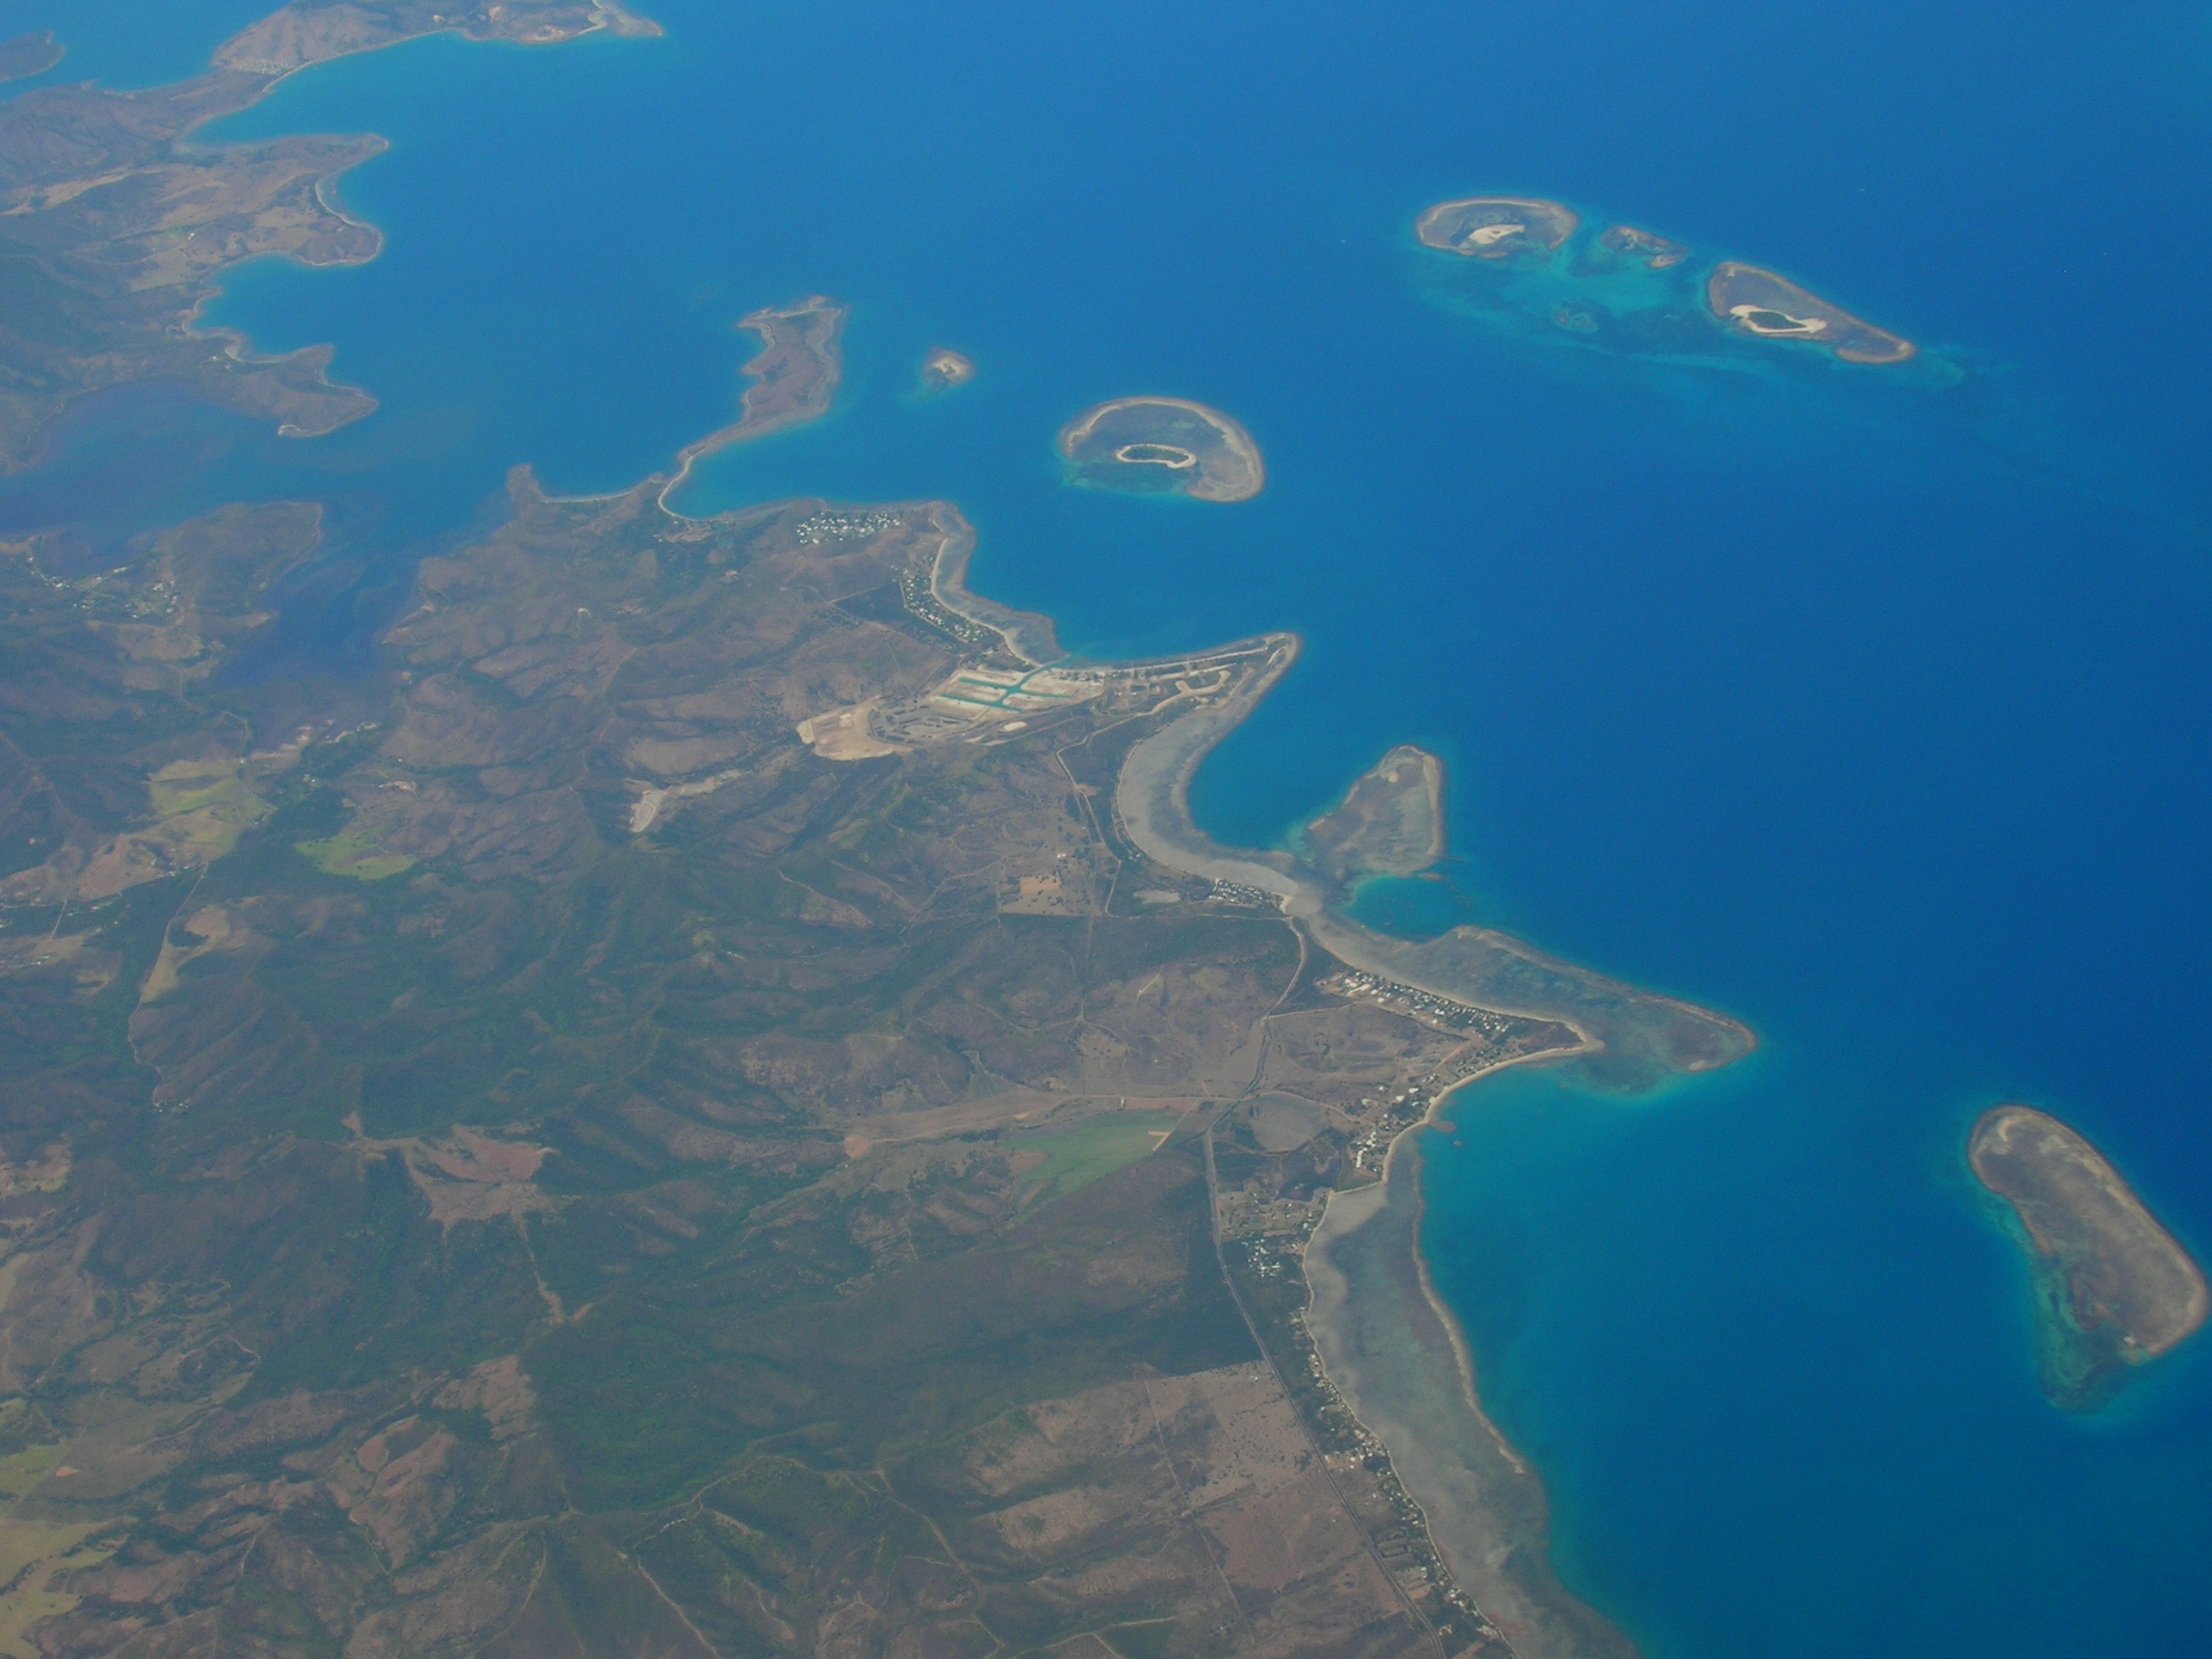
Asukoha La Foa kaart
Interaktiivne kaart
La Foa rahvastik
Aastad 1975 kuni 2020
| Data | 1975 | 1990 | 2000 | 2015 | 2020 |
|---|---|---|---|---|---|
| Rahvastik | 578 | 1289 | 2034 | 3603 | 3905 |
| Rahvastiku tihedus | 1,4 / km² | 3 / km² | 4,8 / km² | 8,4 / km² | 9,1 / km² |
Allikad: JRC (European Commission's Joint Research Centre) töötama GHS built-up grid
La Foa rahvastiku muutus aastast 2000 aastani 2015
Kasv 77.1% aastast 2000 aastani 2015
| Asukoht | Muutus alates 1975 | Muutus alates 1990 | Muutus alates 2000 |
|---|---|---|---|
| La Foa | +523.4% | +179.5% | +77.1% |
| Province Sud | +297.4% | +109.9% | +44.8% |
Allikad: JRC (European Commission's Joint Research Centre) töötama GHS built-up grid
La Foa mediaanvanus
Mediaanvanus: 31.9 aastat
| Asukoht | Mediaanvanus | Keskmine vanus (naine) | Keskmine vanus (mees) |
|---|---|---|---|
| La Foa | 31.9 yrs | 32.5 yrs | 31.1 yrs |
| Province Sud | 31.2 yrs | 31.6 yrs | 30.8 yrs |
Allikad: CIESIN (Center for International Earth Science Information Network)
La Foa rahvastikutihedus
Rahvastikutihedus: 9,1 / km²
| Asukoht | Rahvastik | ala | Tihedus |
|---|---|---|---|
| La Foa | 3905 | 427,3 km² | 9,1 / km² |
| Province Sud | 191 185 | 7313 km² | 26,1 / km² |
Allikad: JRC (European Commission's Joint Research Centre) töötama GHS built-up grid
La Foa ajalooline ja prognoositud rahvastik
Hinnanguline rahvastik aastast 1500 aastani 2100
Allikad:
- JRC (European Commission's Joint Research Centre) töötama GHS built-up grid
- CIESIN (Center for International Earth Science Information Network)
- [Link] Klein Goldewijk, K., Beusen, A., Doelman, J., and Stehfest, E.: Anthropogenic land use estimates for the Holocene – HYDE 3.2, Earth Syst. Sci. Data, 9, 927–953, https://doi.org/10.5194/essd-9-927-2017, 2017.
Suunakoodid
Suunakoodide protsent, mida kasutavad ettevõtted asukohas La Foa
La Foa CO2 heitkogused
Süsinikdioksiidi (CO2) heide inimese kohta tonnides aastas
| Asukoht | CO2 heitkogused | CO2 emissioon elaniku kohta | CO2 heite intensiivsus |
|---|---|---|---|
| La Foa | 77,552 tn | 19.86 tn | 181.5 tons/km² |
| Province Sud | 3,829,153 tn | 20.03 tn | 523.6 tons/km² |
Allikad: [Link] Moran, D., Kanemoto K; Jiborn, M., Wood, R., Többen, J., and Seto, K.C. (2018) 13 000 linna süsinikuheited. Environmental Research Letters DOI: 10.1088/1748-9326/aac72a
La Foa CO2 heitkogused
| 2013. aasta CO2 heitkogused (tonni/aastas) | 77,552 tn |
| 2013. aasta CO2 heitkogused (tonni/aastas) inimese kohta | 19.86 tn |
| 2013. aasta CO2 heitkoguste intensiivsus (tonni/km²/aastas) | 181.5 tons/km² |
Looduslike ohtude oht
Relative risk out of 10
| Oht | Risk Level |
|---|---|
| Drought | Medium (4) |
| Earthquake | Medium (4) |
| Cyclone | High (10) |
* Risk, particularly concerning flood or landslide, may not be for the entire area.
Allikad:
- Dilley, M., R.S. Chen, U. Deichmann, A.L. Lerner-Lam, M. Arnold, J. Agwe, P. Buys, O. Kjekstad, B. Lyon, and G. Yetman. 2005. Natural Disaster Hotspots: A Global Risk Analysis. Washington, D.C.: World Bank. https://doi.org/10.1596/0-8213-5930-4.
- Center for Hazards and Risk Research - CHRR - Columbia University, Center for International Earth Science Information Network - CIESIN - Columbia University, International Bank for Reconstruction and Development - The World Bank, and United Nations Environment Programme Global Resource Information Database Geneva - UNEP/GRID-Geneva. 2005. Global Cyclone Hazard Frequency and Distribution. Palisades, NY: NASA Socioeconomic Data and Applications Center (SEDAC). https://doi.org/10.7927/H4CZ353K.
- Center for Hazards and Risk Research - CHRR - Columbia University, Center for International Earth Science Information Network - CIESIN - Columbia University, and International Research Institute for Climate and Society - IRI - Columbia University. 2005. Global Drought Hazard Frequency and Distribution. Palisades, NY: NASA Socioeconomic Data and Applications Center (SEDAC). https://doi.org/10.7927/H4VX0DFT.
- Center for Hazards and Risk Research - CHRR - Columbia University, Center for International Earth Science Information Network - CIESIN - Columbia University. 2005. Global Earthquake Hazard Distribution - Peak Ground Acceleration. Palisades, NY: NASA Socioeconomic Data and Applications Center (SEDAC). https://doi.org/10.7927/H4BZ63ZS.
Viimased lähedal asuvad maavärinad
Magnituud 3,0 ja suurem
| Kuupäev▼ | Aeg↕ | Magnitude↕ | Distance↕ | Sügavus↕ | Asukoht↕ | Link |
|---|---|---|---|---|---|---|
| 11/8/84 | 6:14 AM | 4.1 | 65.3 km | 33,000 m | New Caledonia | usgs.gov |
| 4/12/84 | 2:49 PM | 4.9 | 92.5 km | 33,000 m | New Caledonia | usgs.gov |
Allikas: U.S. Geological Survey (USGS)

Meie andmete kohta
Sellel lehel olevad andmed on hinnatud mitmete avalikult kättesaadavate tööriistade ja ressursside abil. Need on esitatud ilma garantiita ja võivad sisaldada ebatäpsusi. Kasutage omal vastutusel.