Opoho faktid
| ala | 1.1 km² |
| Rahvastik | 1 |
| Rahvastiku muutus (1975 to 2020) | -99.5% |
| Rahvastiku muutus (2000 to 2020) | -99.6% |
| Kohalik Aeg | |
| Ajatsoon | Uus-Meremaa standardaeg |
| Laius- ja pikkuskraad | -45.84838, 170.52010 |
| Postiindeksid | 9041 |
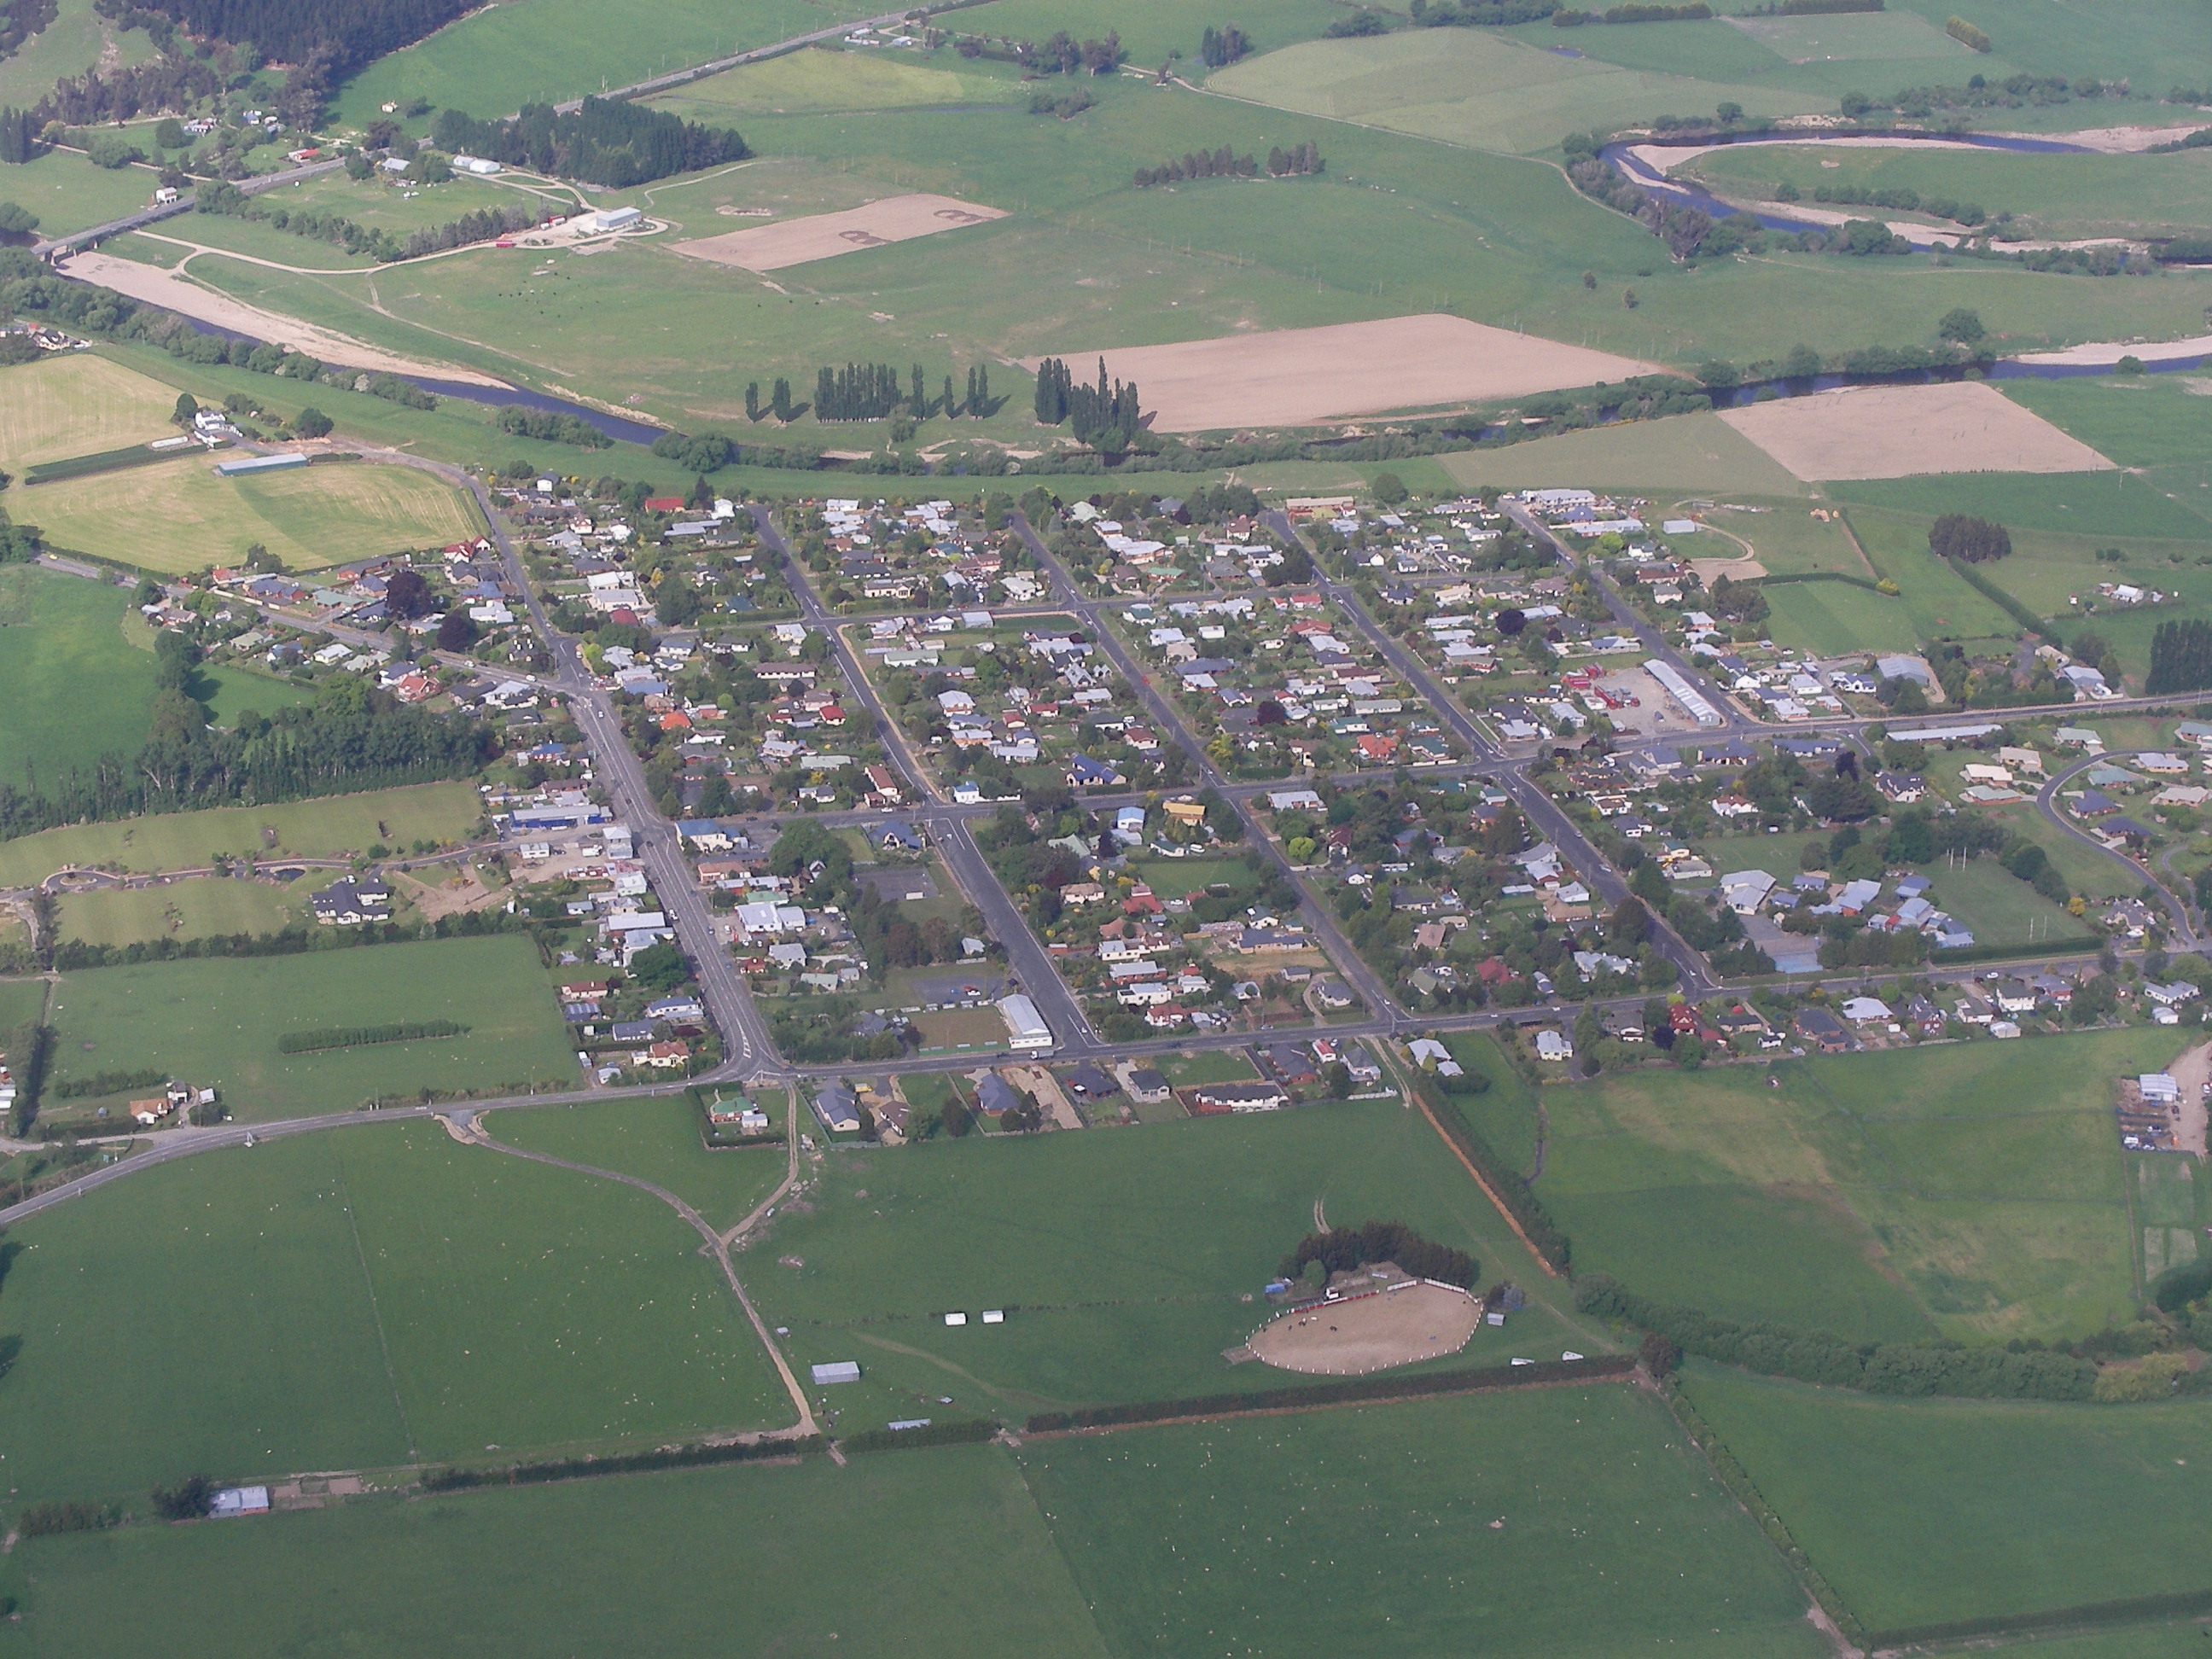
Asukoha Opoho kaart
Interaktiivne kaart
Opoho rahvastik
Aastad 1975 kuni 2030
| Data | 1975 | 1990 | 2000 | 2015 | 2020 | 2025* | 2030* |
|---|---|---|---|---|---|---|---|
| Rahvastik | 199 | 209 | 224 | 242 | 1 | 1 | 1 |
| Rahvastiku tihedus | 187,3 / km² | 196,7 / km² | 210,8 / km² | 227,8 / km² | 0,9 / km² | 0,9 / km² | 0,9 / km² |
* Prognoositud
Allikad: JRC (European Commission's Joint Research Centre) töötama GHS built-up gridOpoho rahvastiku muutus aastast 2000 aastani 2020
Langus 99.6% aastast 2000 aastani 2020
| Asukoht | Muutus alates 1975 | Muutus alates 1990 | Muutus alates 2000 |
|---|---|---|---|
| Opoho | -99.5% | -99.5% | -99.6% |
| Otago | — | — | — |
| Uus-Meremaa | — | — | — |
Allikad: JRC (European Commission's Joint Research Centre) töötama GHS built-up grid
Opoho rahvastikutihedus
Rahvastikutihedus: 0,9 / km²
| Asukoht | Rahvastik | ala | Tihedus |
|---|---|---|---|
| Opoho | 1 | 1,063 km² | 0,9 / km² |
| Otago | 215 607 | 38 478,4 km² | 5,6 / km² |
| Uus-Meremaa | 4,4 million | 270 103,3 km² | 16,3 / km² |
Allikad: JRC (European Commission's Joint Research Centre) töötama GHS built-up grid
Opoho ajalooline ja prognoositud rahvastik
Hinnanguline rahvastik aastast 0 aastani 2100
Allikad:
- JRC (European Commission's Joint Research Centre) töötama GHS built-up grid
- CIESIN (Center for International Earth Science Information Network)
- [Link] Klein Goldewijk, K., Beusen, A., Doelman, J., and Stehfest, E.: Anthropogenic land use estimates for the Holocene – HYDE 3.2, Earth Syst. Sci. Data, 9, 927–953, https://doi.org/10.5194/essd-9-927-2017, 2017.
Inimarengu indeks (HDI)
Eeldatava eluea, hariduse ja elaniku sissetuleku statistiline liitindeks.
Allikas: [Link] Kummu, M., Taka, M. &Guillaume, J. Globaalsed võrgustatud andmestikud sisemajanduse koguprodukti ja inimarengu indeksi kohta perioodil 1990–2015. Sci Data 5, 180004 (2018) doi:10.1038/sdata.2018.4
Opoho CO2 heitkogused
Süsinikdioksiidi (CO2) heide inimese kohta tonnides aastas
| Asukoht | CO2 heitkogused | CO2 emissioon elaniku kohta | CO2 heite intensiivsus |
|---|---|---|---|
| Opoho | 9 tn | 8.93 tn | 8.4 tons/km² |
| Otago | 1,696,568 tn | 7.87 tn | 44.1 tons/km² |
| Uus-Meremaa | 37,929,206 tn | 8.61 tn | 140.4 tons/km² |
Allikad: [Link] Moran, D., Kanemoto K; Jiborn, M., Wood, R., Többen, J., and Seto, K.C. (2018) 13 000 linna süsinikuheited. Environmental Research Letters DOI: 10.1088/1748-9326/aac72a
Opoho CO2 heitkogused
| 2013. aasta CO2 heitkogused (tonni/aastas) | 9 tn |
| 2013. aasta CO2 heitkogused (tonni/aastas) inimese kohta | 8.93 tn |
| 2013. aasta CO2 heitkoguste intensiivsus (tonni/km²/aastas) | 8.4 tons/km² |
Looduslike ohtude oht
Suhteline risk 10st
| Oht | Riski tase |
|---|---|
| Maavärin | Keskmine (7) |
| Maalihke | Keskmine (7) |
* Risk, eriti üleujutuse või maalihke korral, ei pruugi olla kogu piirkonnas.
Allikad:
- Dilley, M., R.S. Chen, U. Deichmann, A.L. Lerner-Lam, M. Arnold, J. Agwe, P. Buys, O. Kjekstad, B. Lyon, and G. Yetman. 2005. Natural Disaster Hotspots: A Global Risk Analysis. Washington, D.C.: World Bank. https://doi.org/10.1596/0-8213-5930-4.
- Center for Hazards and Risk Research - CHRR - Columbia University, Center for International Earth Science Information Network - CIESIN - Columbia University, and Norwegian Geotechnical Institute - NGI. 2005. Global Landslide Hazard Distribution. Palisades, NY: NASA Socioeconomic Data and Applications Center (SEDAC). https://doi.org/10.7927/H4P848VZ.
- Center for Hazards and Risk Research - CHRR - Columbia University, Center for International Earth Science Information Network - CIESIN - Columbia University. 2005. Global Earthquake Hazard Distribution - Peak Ground Acceleration. Palisades, NY: NASA Socioeconomic Data and Applications Center (SEDAC). https://doi.org/10.7927/H4BZ63ZS.
Viimased lähedal asuvad maavärinad
Magnituud 3,0 ja suurem
| Kuupäev▼ | Aeg↕ | Magnitude↕ | Distance↕ | Sügavus↕ | Asukoht↕ | Link |
|---|---|---|---|---|---|---|
| 6/1/15 | 11:18 AM | 4.3 | 33.5 km | 8,990 m | 33km WNW of Dunedin, New Zealand | usgs.gov |
| 10/16/14 | 5:44 AM | 4.1 | 30.1 km | 4,000 m | 29km WNW of Dunedin, New Zealand | usgs.gov |
| 12/17/07 | 9:05 AM | 4.2 | 41 km | 12,000 m | off the east coast of the South Island of New Zealand | usgs.gov |
| 2/24/06 | 11:03 PM | 3.7 | 52 km | 12,000 m | off the east coast of the South Island of New Zealand | usgs.gov |
| 12/24/04 | 8:44 AM | 3.9 | 78.5 km | 12,000 m | South Island of New Zealand | usgs.gov |
| 2/11/04 | 12:31 AM | 4.5 | 74.5 km | 12,000 m | South Island of New Zealand | usgs.gov |
| 6/30/03 | 4:23 PM | 3.8 | 79 km | 21,000 m | South Island of New Zealand | usgs.gov |
| 10/21/00 | 1:57 PM | 4 | 91.8 km | 12,000 m | off the east coast of the South Island of New Zealand | usgs.gov |
| 2/8/98 | 6:26 PM | 4.8 | 97.3 km | 10,000 m | South Island of New Zealand | usgs.gov |
| 5/3/94 | 7:29 AM | 3.8 | 27.8 km | 33,000 m | off the east coast of the South Island of New Zealand | usgs.gov |
Allikas: U.S. Geological Survey (USGS)


Meie andmete kohta
Sellel lehel olevad andmed on hinnatud mitmete avalikult kättesaadavate tööriistade ja ressursside abil. Need on esitatud ilma garantiita ja võivad sisaldada ebatäpsusi. Kasutage omal vastutusel.