Tööstused
Ettevõtete jaotus tööstusharude kaupa piirkonnas Celendín
| Tööstusharu kirjeldus | Asutuste arv |
|---|---|
| Restoranid | 16 |
| Kirikud | 11 |
| Haridus | 10 |
| Pargid | 7 |
| Toidukauplused ja supermarketid | 7 |
| Autoremont | 6 |
| Hotellid ja motellid | 6 |
| Reisibürood | 5 |
| Pangad | 5 |
| Ostlemine | 5 |
| Muud liikmetega organisatsioonid | 5 |
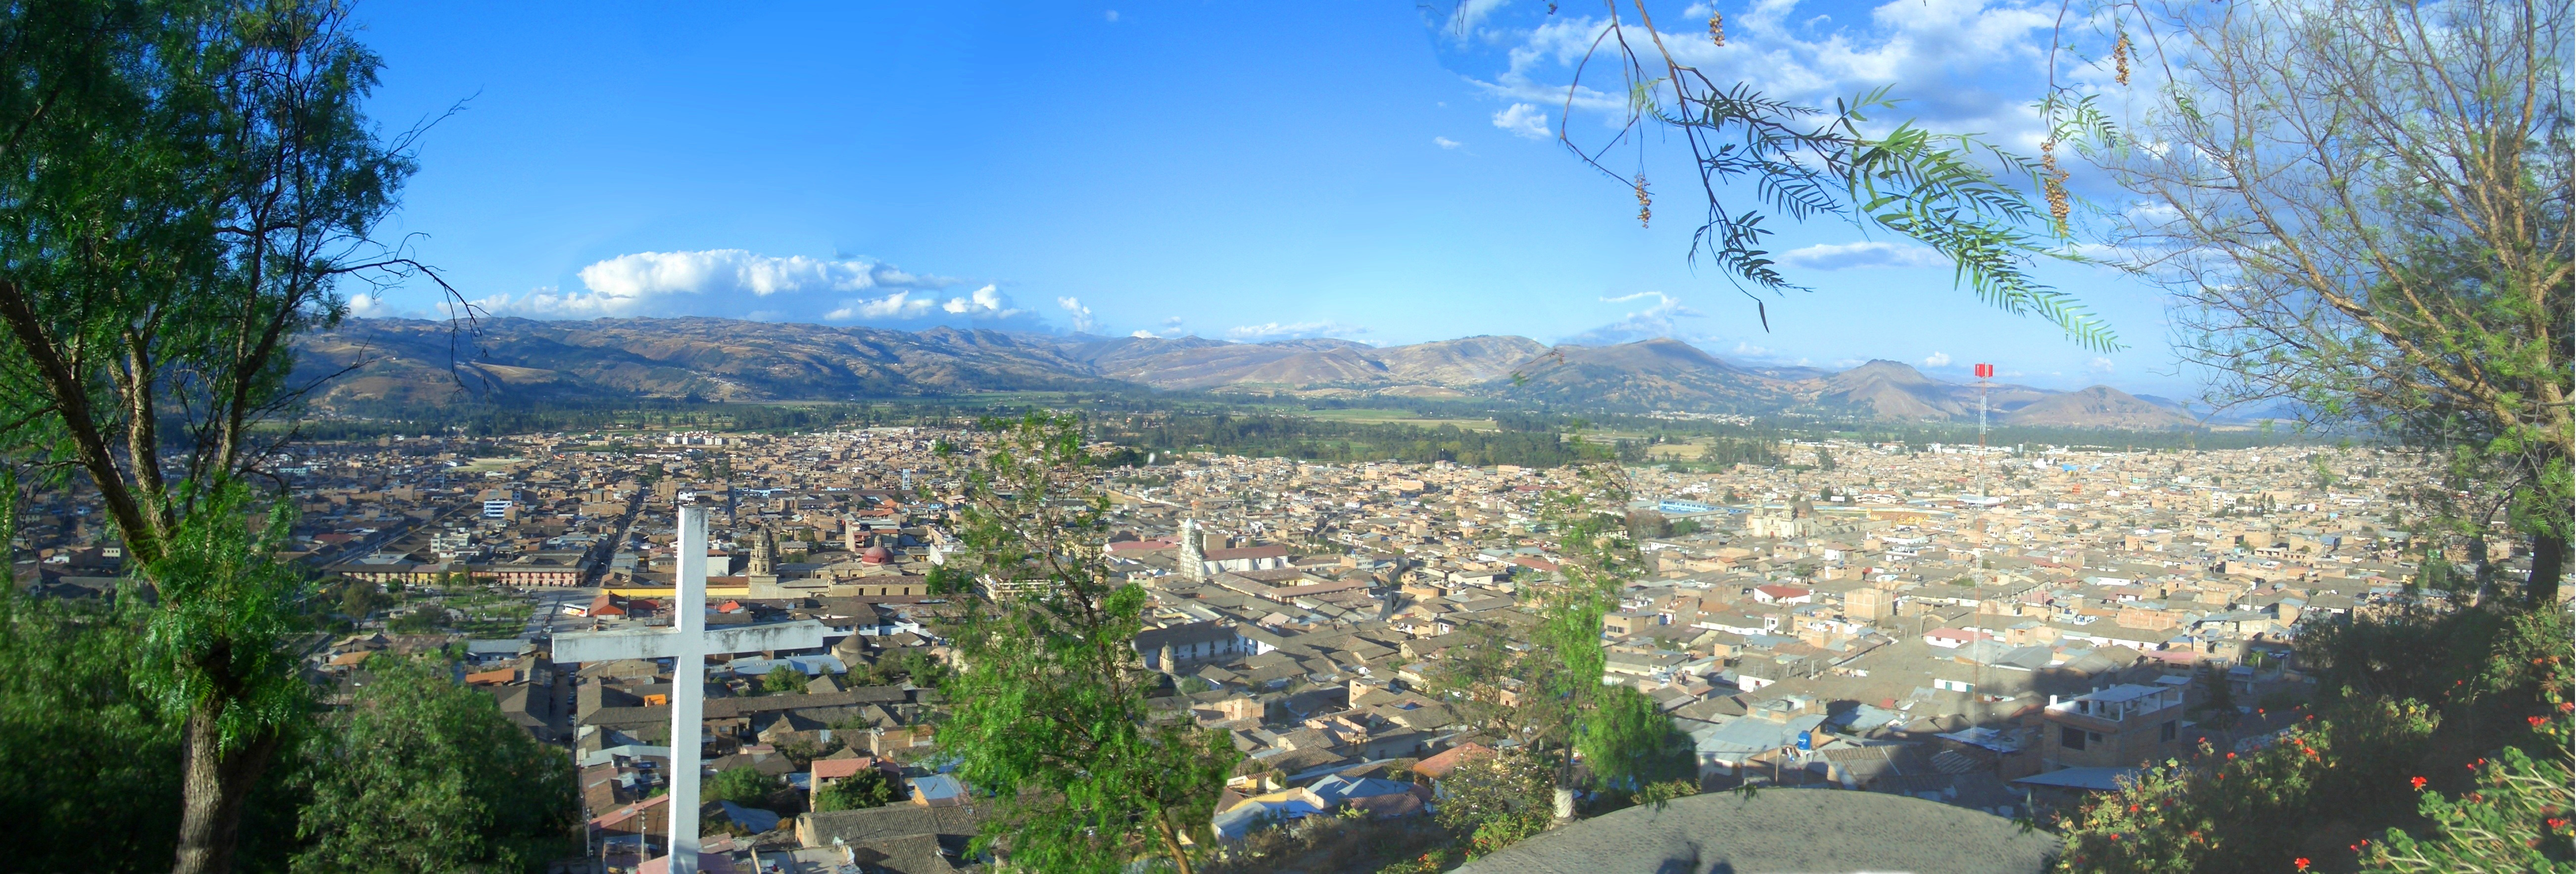
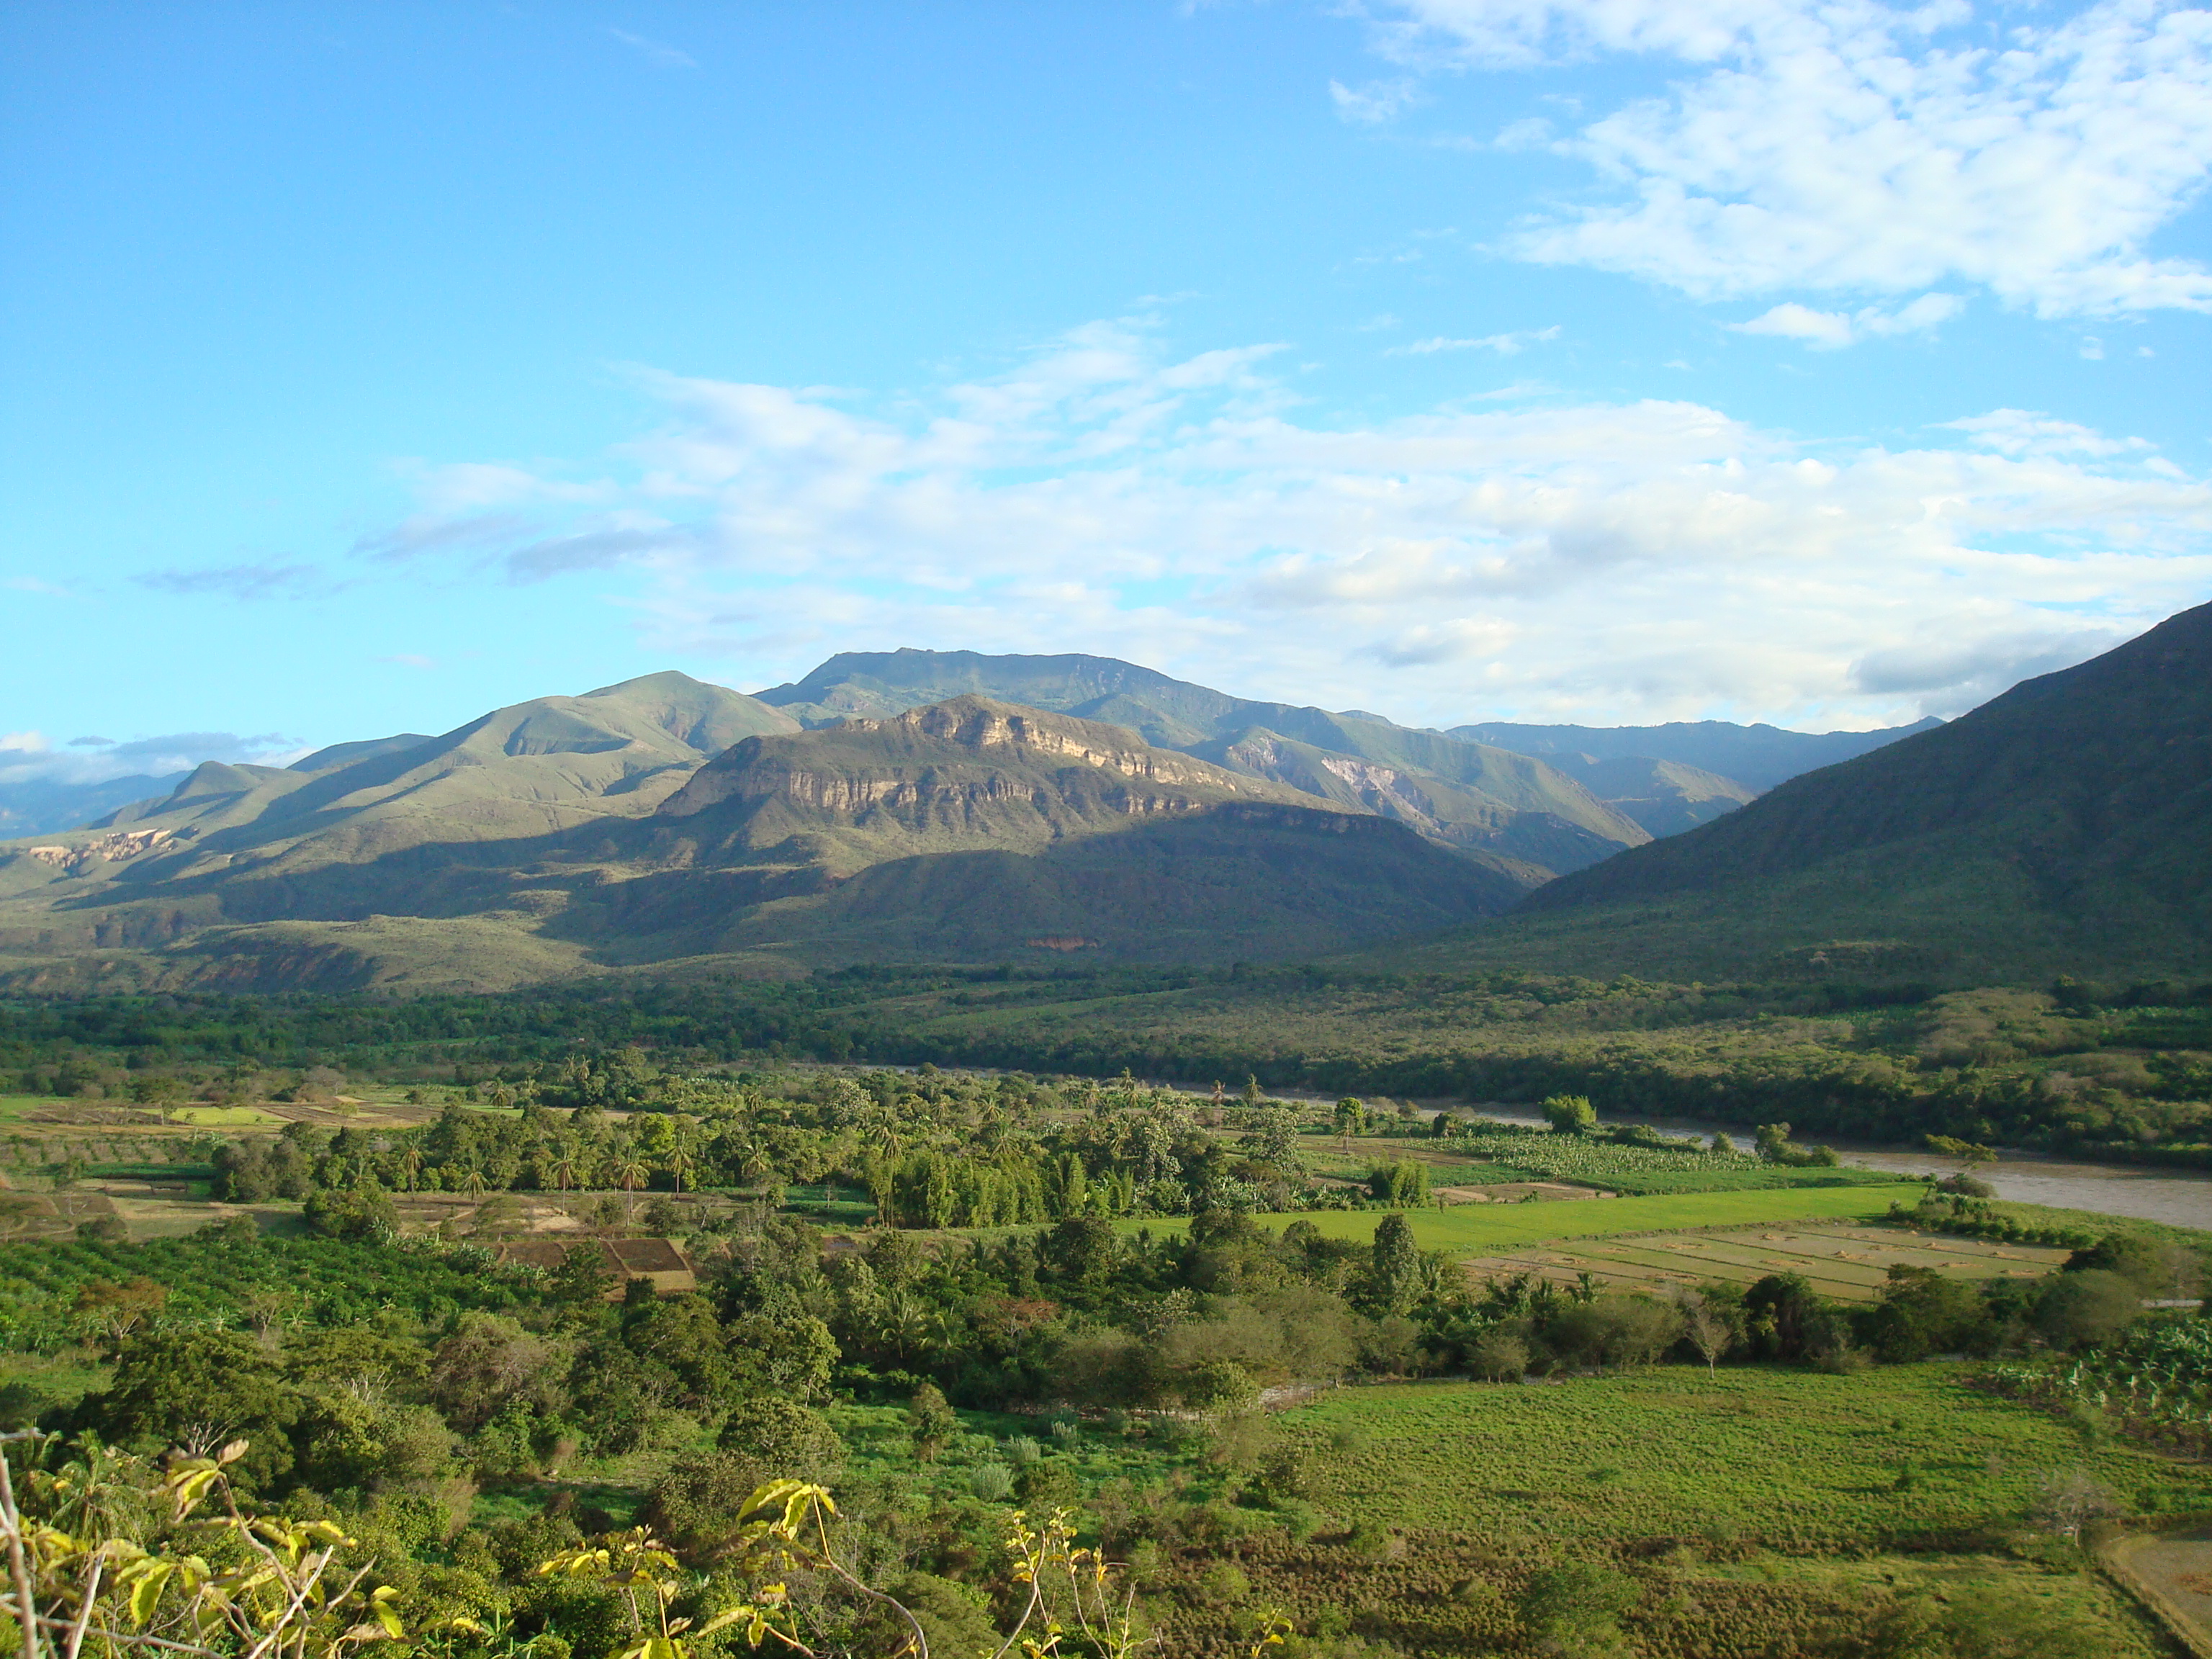
Celendín faktid
| ala | 330.7 km² |
| Rahvastik | 26 008 |
| Meeste populatsioon | 12 508 (48.1%) |
| Naisrahvastik | 13 500 (51.9%) |
| Rahvastiku muutus (1975 to 2020) | +91.0% |
| Rahvastiku muutus (2000 to 2020) | +8.8% |
| Mediaanvanus | 23.2 aastat (Mehed: 22.5, Naised: 23.9) |
| SKT elaniku kohta (PPP) | $5617 (2022) |
| Kohalik Aeg | |
| Ajatsoon | Peruu standardaeg |
| Laius- ja pikkuskraad | -6.86590, -78.14585 |
| Postiindeksid | 06226 |
Asukoha Celendín kaart
Interaktiivne kaart
Celendín rahvastik
Aastad 1975 kuni 2030
| Data | 1975 | 1990 | 2000 | 2015 | 2020 | 2025* | 2030* |
|---|---|---|---|---|---|---|---|
| Rahvastik | 13 615 | 20 397 | 23 914 | 26 607 | 26 008 | 26 067 | 26 094 |
| Rahvastiku tihedus | 41,2 / km² | 61,7 / km² | 72,3 / km² | 80,5 / km² | 78,6 / km² | 78,8 / km² | 78,9 / km² |
Celendín rahvastiku muutus aastast 2000 aastani 2020
Kasv 8.8% aastast 2000 aastani 2020
| Asukoht | Muutus alates 1975 | Muutus alates 1990 | Muutus alates 2000 |
|---|---|---|---|
| Celendín | +91% | +27.5% | +8.8% |
| Cajamarca | — | — | — |
| Peruu | — | — | — |
Celendín mediaanvanus
Mediaanvanus: 23.2 aastat
| Asukoht | Mediaanvanus | Keskmine vanus (naine) | Keskmine vanus (mees) |
|---|---|---|---|
| Celendín | 23.2 yrs | 23.9 yrs | 22.5 yrs |
| Cajamarca | 22.8 yrs | 23.3 yrs | 22.3 yrs |
| Peruu | 25.1 yrs | 25.6 yrs | 24.6 yrs |
Celendín rahvastikutihedus
Rahvastikutihedus: 78,6 / km²
| Asukoht | Rahvastik | ala | Tihedus |
|---|---|---|---|
| Celendín | 26 008 | 330,7 km² | 78,6 / km² |
| Cajamarca | 1,5 million | 32 940,7 km² | 44,4 / km² |
| Peruu | 31 million | 1 291 975 km² | 24 / km² |
Celendín ajalooline ja prognoositud rahvastik
Hinnanguline rahvastik aastast 0 aastani 2100
- JRC (European Commission's Joint Research Centre) töötama GHS built-up grid
- CIESIN (Center for International Earth Science Information Network)
- [Link] Klein Goldewijk, K., Beusen, A., Doelman, J., and Stehfest, E.: Anthropogenic land use estimates for the Holocene – HYDE 3.2, Earth Syst. Sci. Data, 9, 927–953, https://doi.org/10.5194/essd-9-927-2017, 2017.
Inimarengu indeks (HDI)
Eeldatava eluea, hariduse ja elaniku sissetuleku statistiline liitindeks.
Celendín sisemajanduse koguprodukt (SKT)
SKT elaniku kohta, PPP (2017. aasta püsivates rahvusvahelistes dollarites)
| Data | 1990 | 1995 | 2000 | 2005 | 2010 | 2015 | 2020 | 2022 |
|---|---|---|---|---|---|---|---|---|
| SKT elaniku kohta | $2329 | $3213 | $3826 | $5129 | $7344 | $7950 | $4954 | $5617 |
| SKT kokku | $48,1 mln | $73,6 mln | $96,6 mln | $132,5 mln | $185,5 mln | $197,6 mln | $130,3 mln | $147,9 mln |
Celendín CO2 heitkogused
Süsinikdioksiidi (CO2) heide inimese kohta tonnides aastas
| Asukoht | CO2 heitkogused | CO2 emissioon elaniku kohta | CO2 heite intensiivsus |
|---|---|---|---|
| Celendín | 53,341 tn | 2.05 tn | 161.3 tons/km² |
| Cajamarca | 2,997,835 tn | 2.05 tn | 91 tons/km² |
| Peruu | 71,626,946 tn | 2.31 tn | 55.4 tons/km² |
| 2013. aasta CO2 heitkogused (tonni/aastas) | 53,341 tn |
| 2013. aasta CO2 heitkogused (tonni/aastas) inimese kohta | 2.05 tn |
| 2013. aasta CO2 heitkoguste intensiivsus (tonni/km²/aastas) | 161.3 tons/km² |
Looduslike ohtude oht
Suhteline risk 10st
| Oht | Riski tase |
|---|---|
| Põud | Madal (2) |
| Üleujutus | Keskmine (7) |
| Maavärin | Keskmine (7) |
| Maalihke | Keskmine (7) |
* Risk, eriti üleujutuse või maalihke korral, ei pruugi olla kogu piirkonnas.
- Dilley, M., R.S. Chen, U. Deichmann, A.L. Lerner-Lam, M. Arnold, J. Agwe, P. Buys, O. Kjekstad, B. Lyon, and G. Yetman. 2005. Natural Disaster Hotspots: A Global Risk Analysis. Washington, D.C.: World Bank. https://doi.org/10.1596/0-8213-5930-4.
- Center for Hazards and Risk Research - CHRR - Columbia University, Center for International Earth Science Information Network - CIESIN - Columbia University, and Norwegian Geotechnical Institute - NGI. 2005. Global Landslide Hazard Distribution. Palisades, NY: NASA Socioeconomic Data and Applications Center (SEDAC). https://doi.org/10.7927/H4P848VZ.
- Center for Hazards and Risk Research - CHRR - Columbia University, Center for International Earth Science Information Network - CIESIN - Columbia University, and International Research Institute for Climate and Society - IRI - Columbia University. 2005. Global Drought Hazard Frequency and Distribution. Palisades, NY: NASA Socioeconomic Data and Applications Center (SEDAC). https://doi.org/10.7927/H4VX0DFT.
- Center for Hazards and Risk Research - CHRR - Columbia University, Center for International Earth Science Information Network - CIESIN - Columbia University. 2005. Global Flood Hazard Frequency and Distribution. Palisades, NY: NASA Socioeconomic Data and Applications Center (SEDAC). https://doi.org/10.7927/H4668B3D.
- Center for Hazards and Risk Research - CHRR - Columbia University, Center for International Earth Science Information Network - CIESIN - Columbia University. 2005. Global Earthquake Hazard Distribution - Peak Ground Acceleration. Palisades, NY: NASA Socioeconomic Data and Applications Center (SEDAC). https://doi.org/10.7927/H4BZ63ZS.
Viimased lähedal asuvad maavärinad
Magnituud 3,0 ja suurem
| Kuupäev▼ | Aeg↕ | Magnitude↕ | Distance↕ | Sügavus↕ | Asukoht↕ | Link |
|---|---|---|---|---|---|---|
| 4/11/05 | 2:54 PM | 6 | 55.3 km | 129,900 m | northern Peru | usgs.gov |
| 12/1/98 | 2:55 PM | 4.5 | 68.5 km | 33,000 m | northern Peru | usgs.gov |
| 6/20/94 | 10:02 AM | 4.6 | 2.6 km | 125,000 m | northern Peru | usgs.gov |
| 8/30/85 | 4:44 AM | 4.3 | 92.4 km | 33,000 m | northern Peru | usgs.gov |
| 7/30/79 | 1:43 PM | 4.6 | 22.3 km | 33,000 m | northern Peru | usgs.gov |
| 5/20/79 | 1:43 AM | 5.7 | 94.3 km | 33,000 m | northern Peru | usgs.gov |
| 3/5/74 | 12:55 AM | 4 | 66 km | 235,000 m | northern Peru | usgs.gov |

Meie andmete kohta
Sellel lehel olevad andmed on hinnatud mitmete avalikult kättesaadavate tööriistade ja ressursside abil. Need on esitatud ilma garantiita ja võivad sisaldada ebatäpsusi. Kasutage omal vastutusel.