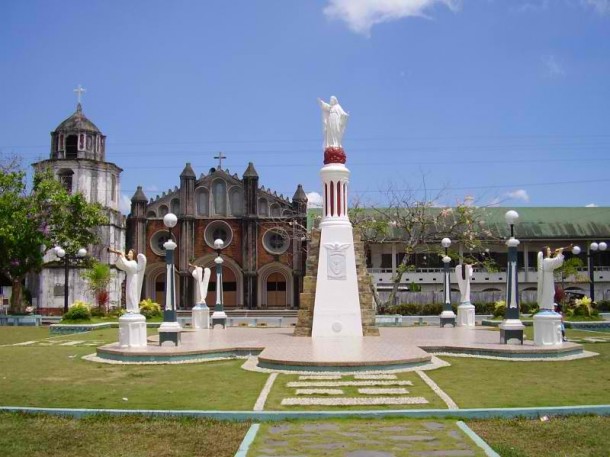
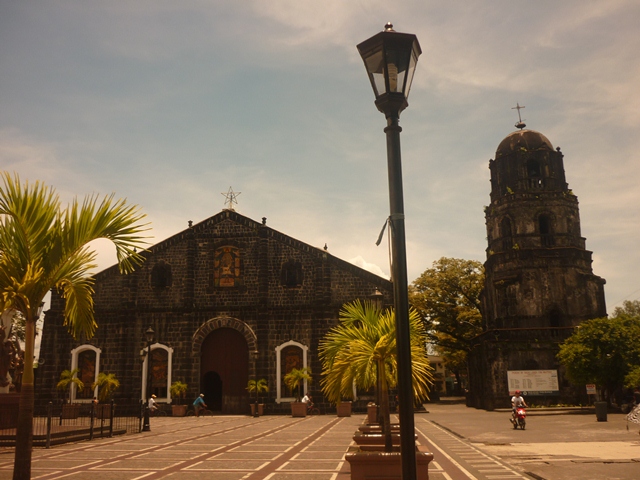
Kategooriad asukohas Buhi
Tööstused
Ettevõtete jaotus tööstusharude kaupa piirkonnas Buhi
| Tööstusharu kirjeldus | Asutuste arv |
|---|---|
| Haridus | 48 |
| Kirikud | 31 |
| Restoranid | 30 |
| Religioon | 19 |
| Ostlemine | 18 |
| Avalik haldus | 14 |
| Reisibürood | 12 |
| Reisimine ja transport | 9 |
| Pargid | 9 |
| Muu majutus | 9 |
Buhi faktid
| ala | 203.3 km² |
| Rahvastik | 117 408 |
| Meeste populatsioon | 59 584 (50.7%) |
| Naisrahvastik | 57 824 (49.3%) |
| Rahvastiku muutus (1975 to 2020) | +469.9% |
| Rahvastiku muutus (2000 to 2020) | +56.4% |
| Mediaanvanus | 21.1 aastat (Mehed: 20.7, Naised: 21.7) |
| SKT elaniku kohta (PPP) | $3862 (2022) |
| Suunakoodid | 54 |
| Piirkonnad | San Pedro, San Buena, San Pascual, San Jose Baybayon, Balong-Bato |
| Kohalik Aeg | |
| Ajatsoon | Filipiini standardaeg |
| Laius- ja pikkuskraad | 13.43220, 123.51700 |
| Postiindeksid | 4433 |
Asukoha Buhi kaart
Interaktiivne kaart
Buhi rahvastik
Aastad 1975 kuni 2030
| Data | 1975 | 1990 | 2000 | 2015 | 2020 | 2025* | 2030* |
|---|---|---|---|---|---|---|---|
| Rahvastik | 20 602 | 53 387 | 75 077 | 100 883 | 117 408 | 129 877 | 141 160 |
| Rahvastiku tihedus | 101,4 / km² | 262,7 / km² | 369,4 / km² | 496,3 / km² | 577,7 / km² | 639 / km² | 694,5 / km² |
Buhi rahvastiku muutus aastast 2000 aastani 2020
Kasv 56.4% aastast 2000 aastani 2020
| Asukoht | Muutus alates 1975 | Muutus alates 1990 | Muutus alates 2000 |
|---|---|---|---|
| Buhi | +469.9% | +119.9% | +56.4% |
| Filipiinid | — | — | — |
Buhi mediaanvanus
Mediaanvanus: 21.1 aastat
| Asukoht | Mediaanvanus | Keskmine vanus (naine) | Keskmine vanus (mees) |
|---|---|---|---|
| Buhi | 21.1 yrs | 21.7 yrs | 20.7 yrs |
| Filipiinid | 23.2 yrs | 23.6 yrs | 22.8 yrs |
Buhi rahvastikutihedus
Rahvastikutihedus: 578 / km²
| Asukoht | Rahvastik | ala | Tihedus |
|---|---|---|---|
| Buhi | 117 408 | 203,3 km² | 578 / km² |
| Filipiinid | 96,6 million | 296 939,4 km² | 325 / km² |
Buhi ajalooline ja prognoositud rahvastik
Hinnanguline rahvastik aastast 1860 aastani 2100
- JRC (European Commission's Joint Research Centre) töötama GHS built-up grid
- CIESIN (Center for International Earth Science Information Network)
- [Link] Klein Goldewijk, K., Beusen, A., Doelman, J., and Stehfest, E.: Anthropogenic land use estimates for the Holocene – HYDE 3.2, Earth Syst. Sci. Data, 9, 927–953, https://doi.org/10.5194/essd-9-927-2017, 2017.
Linnaosad piirkonnas Buhi
Ettevõtete osakaal linnaosade kaupa piirkonnas Buhi
Suunakoodid
Suunakoodide protsent, mida kasutavad ettevõtted asukohas Buhi
Postiindeksid
Ettevõtete osakaal sihtnumbrite kaupa piirkonnas Buhi
Hinnajaotus
Asukoha Buhi ettevõtete jaotus hinna alusel
Inimarengu indeks (HDI)
Eeldatava eluea, hariduse ja elaniku sissetuleku statistiline liitindeks.
Buhi sisemajanduse koguprodukt (SKT)
SKT elaniku kohta, PPP (2017. aasta püsivates rahvusvahelistes dollarites)
| Data | 1990 | 1995 | 2000 | 2005 | 2010 | 2015 | 2020 | 2022 |
|---|---|---|---|---|---|---|---|---|
| SKT elaniku kohta | $2287 | $2648 | $3039 | $3211 | $2889 | $2995 | $3776 | $3862 |
| SKT kokku | $43,1 mln | $59,3 mln | $82 mln | $101,3 mln | $101 mln | $118,5 mln | $165 mln | $178,7 mln |
Buhi CO2 heitkogused
Süsinikdioksiidi (CO2) heide inimese kohta tonnides aastas
| Asukoht | CO2 heitkogused | CO2 emissioon elaniku kohta | CO2 heite intensiivsus |
|---|---|---|---|
| Buhi | 129,950 tn | 1.11 tn | 639.4 tons/km² |
| Filipiinid | 104,920,564 tn | 1.09 tn | 353.3 tons/km² |
| 2013. aasta CO2 heitkogused (tonni/aastas) | 129,950 tn |
| 2013. aasta CO2 heitkogused (tonni/aastas) inimese kohta | 1.11 tn |
| 2013. aasta CO2 heitkoguste intensiivsus (tonni/km²/aastas) | 639.4 tons/km² |
Looduslike ohtude oht
Suhteline risk 10st
| Oht | Riski tase |
|---|---|
| Põud | Keskmine (5) |
| Üleujutus | Keskmine (7) |
| Maavärin | Kõrge (8) |
| Tsüklon | Kõrge (10) |
| Maalihke | Kõrge (10) |
| Vulkaan | Kõrge (10) |
* Risk, eriti üleujutuse või maalihke korral, ei pruugi olla kogu piirkonnas.
- Dilley, M., R.S. Chen, U. Deichmann, A.L. Lerner-Lam, M. Arnold, J. Agwe, P. Buys, O. Kjekstad, B. Lyon, and G. Yetman. 2005. Natural Disaster Hotspots: A Global Risk Analysis. Washington, D.C.: World Bank. https://doi.org/10.1596/0-8213-5930-4.
- Center for Hazards and Risk Research - CHRR - Columbia University, Center for International Earth Science Information Network - CIESIN - Columbia University, and Norwegian Geotechnical Institute - NGI. 2005. Global Landslide Hazard Distribution. Palisades, NY: NASA Socioeconomic Data and Applications Center (SEDAC). https://doi.org/10.7927/H4P848VZ.
- Center for Hazards and Risk Research - CHRR - Columbia University, Center for International Earth Science Information Network - CIESIN - Columbia University, International Bank for Reconstruction and Development - The World Bank, and United Nations Environment Programme Global Resource Information Database Geneva - UNEP/GRID-Geneva. 2005. Global Cyclone Hazard Frequency and Distribution. Palisades, NY: NASA Socioeconomic Data and Applications Center (SEDAC). https://doi.org/10.7927/H4CZ353K.
- Center for Hazards and Risk Research - CHRR - Columbia University, Center for International Earth Science Information Network - CIESIN - Columbia University, and International Research Institute for Climate and Society - IRI - Columbia University. 2005. Global Drought Hazard Frequency and Distribution. Palisades, NY: NASA Socioeconomic Data and Applications Center (SEDAC). https://doi.org/10.7927/H4VX0DFT.
- Center for Hazards and Risk Research - CHRR - Columbia University, Center for International Earth Science Information Network - CIESIN - Columbia University. 2005. Global Flood Hazard Frequency and Distribution. Palisades, NY: NASA Socioeconomic Data and Applications Center (SEDAC). https://doi.org/10.7927/H4668B3D.
- Center for Hazards and Risk Research - CHRR - Columbia University, Center for International Earth Science Information Network - CIESIN - Columbia University. 2005. Global Volcano Hazard Frequency and Distribution. Palisades, NY: NASA Socioeconomic Data and Applications Center (SEDAC). https://doi.org/10.7927/H4BR8Q45.
- Center for Hazards and Risk Research - CHRR - Columbia University, Center for International Earth Science Information Network - CIESIN - Columbia University. 2005. Global Earthquake Hazard Distribution - Peak Ground Acceleration. Palisades, NY: NASA Socioeconomic Data and Applications Center (SEDAC). https://doi.org/10.7927/H4BZ63ZS.
Viimased lähedal asuvad maavärinad
Magnituud 3,0 ja suurem
| Kuupäev▼ | Aeg↕ | Magnitude↕ | Distance↕ | Sügavus↕ | Asukoht↕ | Link |
|---|---|---|---|---|---|---|
| 5/14/19 | 1:36 AM | 4.3 | 76.8 km | 35,000 m | 13km NW of Monreal, Philippines | usgs.gov |
| 3/19/19 | 2:59 AM | 4.2 | 79.8 km | 113,590 m | 2km N of Casiguran, Philippines | usgs.gov |
| 12/6/18 | 9:26 AM | 4.2 | 72.4 km | 64,430 m | 1km NE of Sorsogon, Philippines | usgs.gov |
| 11/5/17 | 3:36 PM | 4.6 | 48.5 km | 54,840 m | 4km E of Maslog, Philippines | usgs.gov |
| 9/21/17 | 3:39 AM | 4.5 | 72.5 km | 36,420 m | 6km ESE of Mabiton, Philippines | usgs.gov |
| 7/30/17 | 3:31 PM | 4.4 | 68.9 km | 76,320 m | 1km SSE of Capuy, Philippines | usgs.gov |
| 1/11/17 | 6:24 AM | 4.8 | 64.5 km | 75,030 m | 17km S of Calolbon, Philippines | usgs.gov |
| 1/13/16 | 8:46 PM | 4.2 | 43 km | 35,000 m | 5km NNE of Cagmanaba, Philippines | usgs.gov |
| 5/13/15 | 5:00 PM | 4.5 | 72.8 km | 56,900 m | 8km NE of Bacon, Philippines | usgs.gov |
| 3/16/15 | 12:09 AM | 4.4 | 47.2 km | 35,000 m | 3km WSW of Pio Duran, Philippines | usgs.gov |

Meie andmete kohta
Sellel lehel olevad andmed on hinnatud mitmete avalikult kättesaadavate tööriistade ja ressursside abil. Need on esitatud ilma garantiita ja võivad sisaldada ebatäpsusi. Kasutage omal vastutusel.